Fig. 4
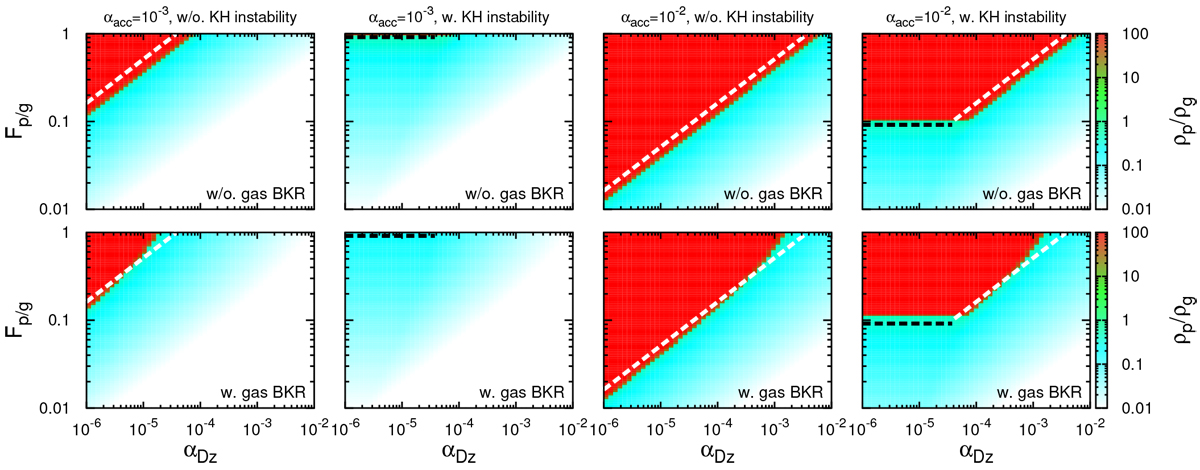
Midplane pebble-to-gas density ratio (Z = ρp∕ρg) as a functionof αDz and Fp/g (at r = 5 au and τs,p = 0.125). Top panels: cases where the back-reaction onto the gas motion is neglected (i.e., vg = vg,ν). Bottom panels: cases where the back-reaction to the gas motion is included, following Eq. (16). The color contours are obtained by directly solving Eq. (86). Left and right two panels: cases where αacc = 10−3 and αacc = 10−2 with/without a KH instability (Ri = 0.5), respectively. The red-colored regions indicate where a steady-state solution is not found (i.e., ρp ∕ρg > 100 and it keeps increasing; the “no-drift (ND)” region). The white (Eq. (91)) and black (Eq. (95) with Ri = 0.5) dashed lines are analytically derived critical Fp/g,crit above which no steady-state are found (the “no-drift (ND)” region). Analytical predictions (dashed lines) well predict critical boundaries of the ND region. Including a KH instability reduces the ND region as the minimum scale height of pebbles is regulated by a KH instability. Due to the back-reaction to the gas motion that slows down the radial velocity of the gas, the midplane concentration of pebbles as well as the ND region (red-colored region) are shifted toward slightly larger Fp/g values.
Current usage metrics show cumulative count of Article Views (full-text article views including HTML views, PDF and ePub downloads, according to the available data) and Abstracts Views on Vision4Press platform.
Data correspond to usage on the plateform after 2015. The current usage metrics is available 48-96 hours after online publication and is updated daily on week days.
Initial download of the metrics may take a while.