Fig. 3
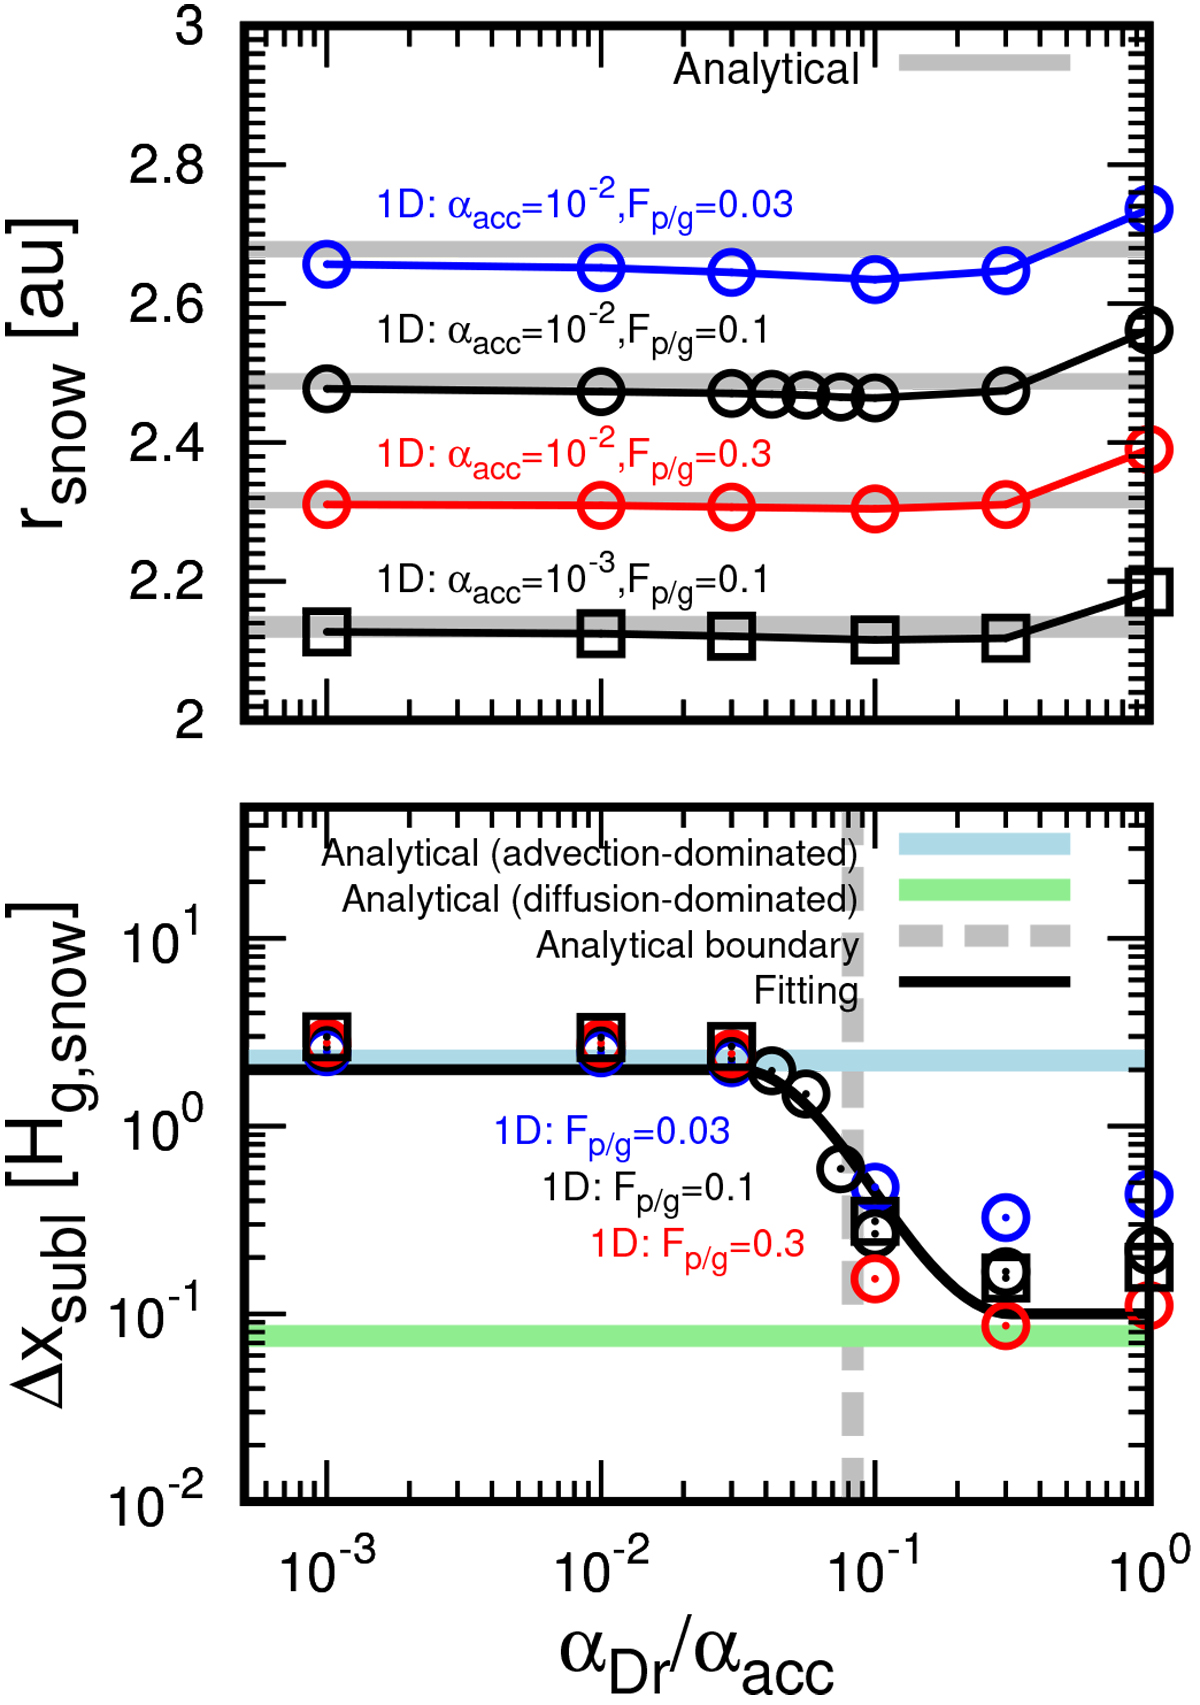
Radial location of the snow line (top panel) and sublimation width of drifting pebbles Δxsubl (bottom panel) as a function of αDr∕αacc. Here, fd/p = 0 (i.e., pure icy pebbles). Circles (αacc = 10−2) and squares (αacc = 10−3) represent the results of 1D simulations. Blue, black and red colors indicate those for Fp/g = 0.03, 0.1 and 0.3, respectively. Analytically derived locations of the snow lines (solving Eq. (44)) are shown bythe gray lines (top panel). The light-blue line in the bottom panel shows the analytical Δxsubl in the case of the advection-dominated regime (Eq. (54) with rsnow = 2.4 au and β = 0.5). The light-green line in the bottom panel shows the analytical Δxsubl in the case of the diffusion-dominated regime (Eq. (68) with τs,p = 0.06, rp = 2.3 cm, rsnow = 2.4 au). The gray dashed line in the bottom panel shows the analytically derived boundary betweenthe advection- and diffusion-dominated regimes (Eq. (73) with r = 2.4 au and β = 0.5). A fitting function is shown by a black line (Eq. (74)).
Current usage metrics show cumulative count of Article Views (full-text article views including HTML views, PDF and ePub downloads, according to the available data) and Abstracts Views on Vision4Press platform.
Data correspond to usage on the plateform after 2015. The current usage metrics is available 48-96 hours after online publication and is updated daily on week days.
Initial download of the metrics may take a while.