Fig. 9.
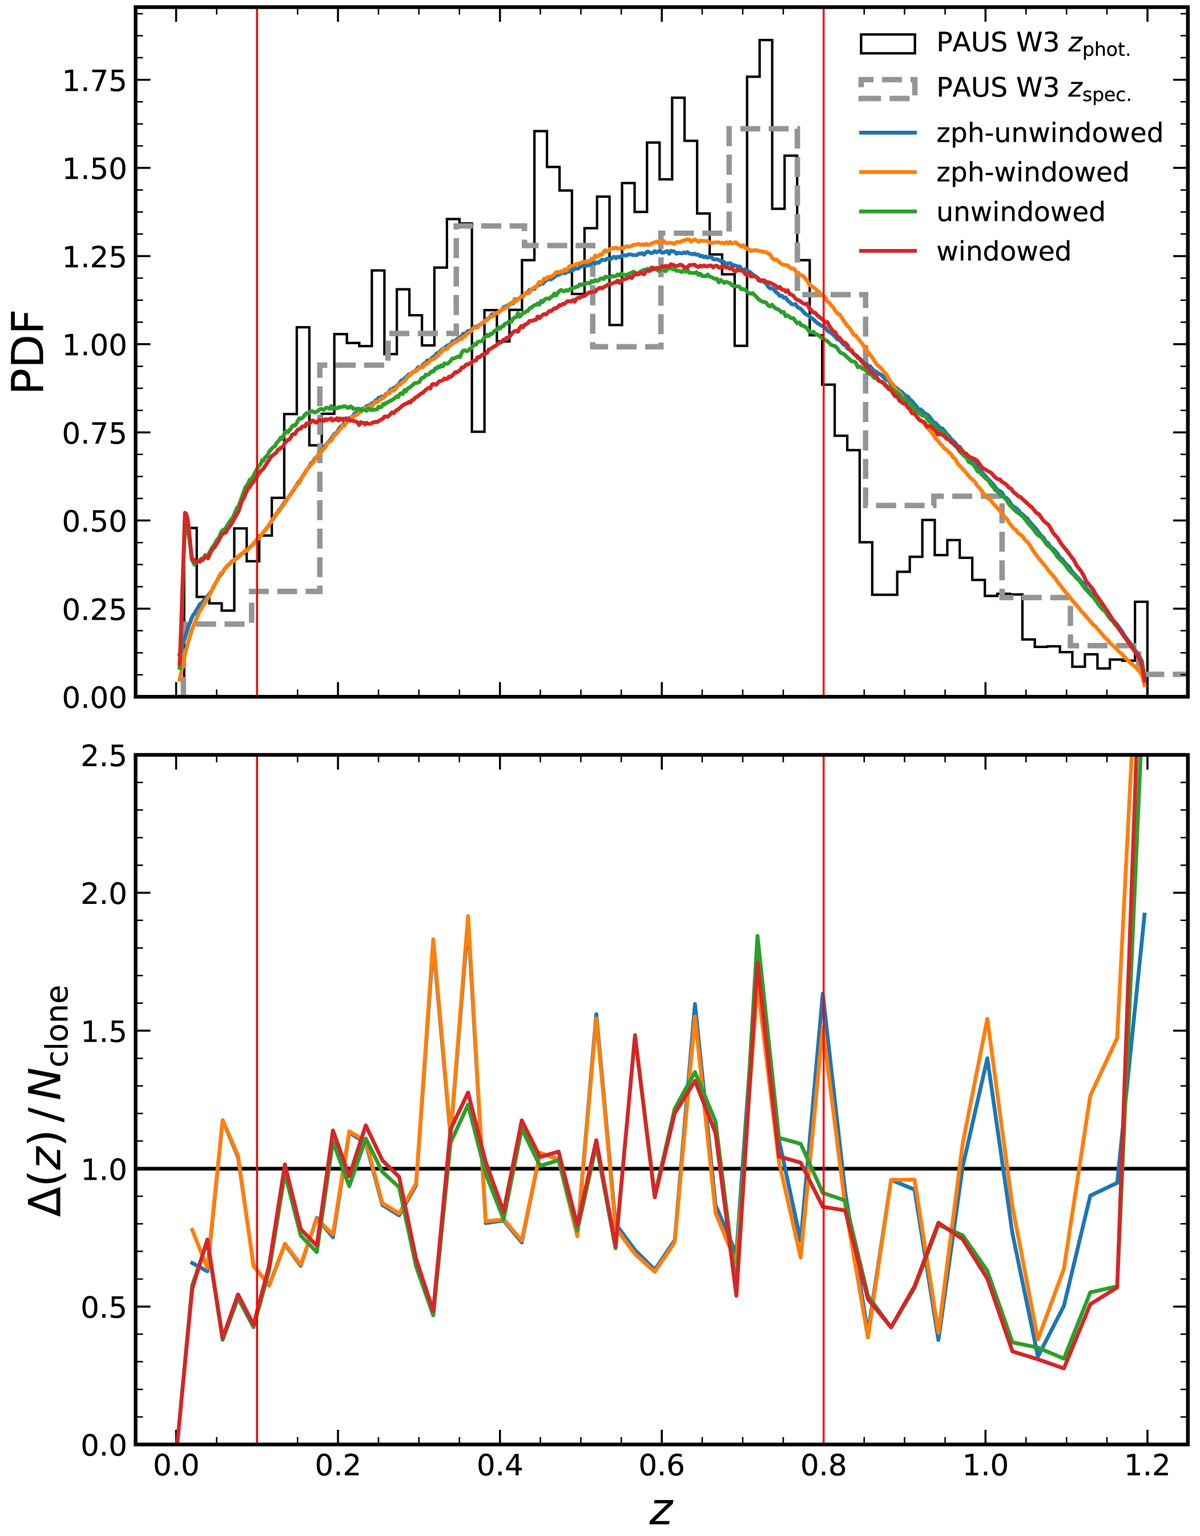
Top: photometric redshift distribution of PAUS W3 (black solid), with spectroscopic redshifts of the DEEP2-matched galaxies (grey dashed), overlain with the randoms’ n(z), generated with and without the windowing (Sect. 3.2) and photo-z (‘zph-randoms’; Sect. 3.3) approaches, as indicated in the legend. Bottom: density contrast Δ(z) (Eq. (13)) computed after the final iteration of clone dispersal for each set of randoms – for zph-randoms, the ratio ngal(z) / nrand.(z) (Eq. (13)) is computed against galaxy redshifts drawn from n(zspec. | zphot.) (see Sect. 3.3), such that ngal(z)≠n(zphot.) and Δ(z) / Nclone can be greater than unity where nrand.(z) > n(zphot.), e.g., at zphot. ∼ 1. Our zph-randoms methods yield smoother redshift distributions, more faithful to the available n(zspec.). Red vertical lines delimit the redshift range employed in our correlation function analysis.
Current usage metrics show cumulative count of Article Views (full-text article views including HTML views, PDF and ePub downloads, according to the available data) and Abstracts Views on Vision4Press platform.
Data correspond to usage on the plateform after 2015. The current usage metrics is available 48-96 hours after online publication and is updated daily on week days.
Initial download of the metrics may take a while.