Fig. 8.
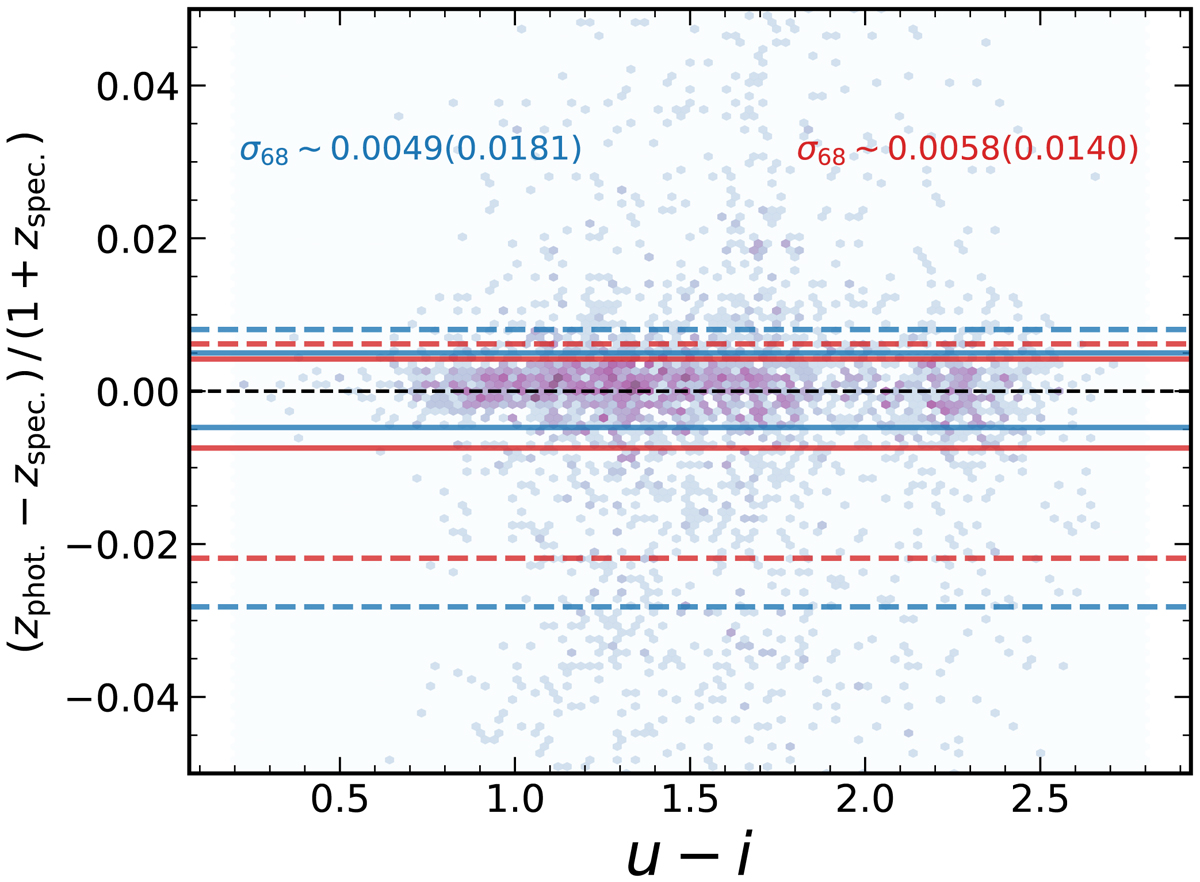
Hexagonally-binned 2D histogram of PAUS-DEEP2 matched galaxies’ photo-z error, normalised by their spectroscopic redshifts and as a function of their LEPHARE rest-frame colour u − i. Shading indicates the log-counts in each cell. For the best 50% of photo-z according to the Qz parameter, we display the 16th, 84th percentiles of the normalised photo-z error for red (blue) galaxies as solid red (blue) horizontal lines. Half the difference between the percentiles is quoted for each as σ68. Dashed lines and bracketed values of σ68 are then for the total sample.
Current usage metrics show cumulative count of Article Views (full-text article views including HTML views, PDF and ePub downloads, according to the available data) and Abstracts Views on Vision4Press platform.
Data correspond to usage on the plateform after 2015. The current usage metrics is available 48-96 hours after online publication and is updated daily on week days.
Initial download of the metrics may take a while.