Fig. 6.
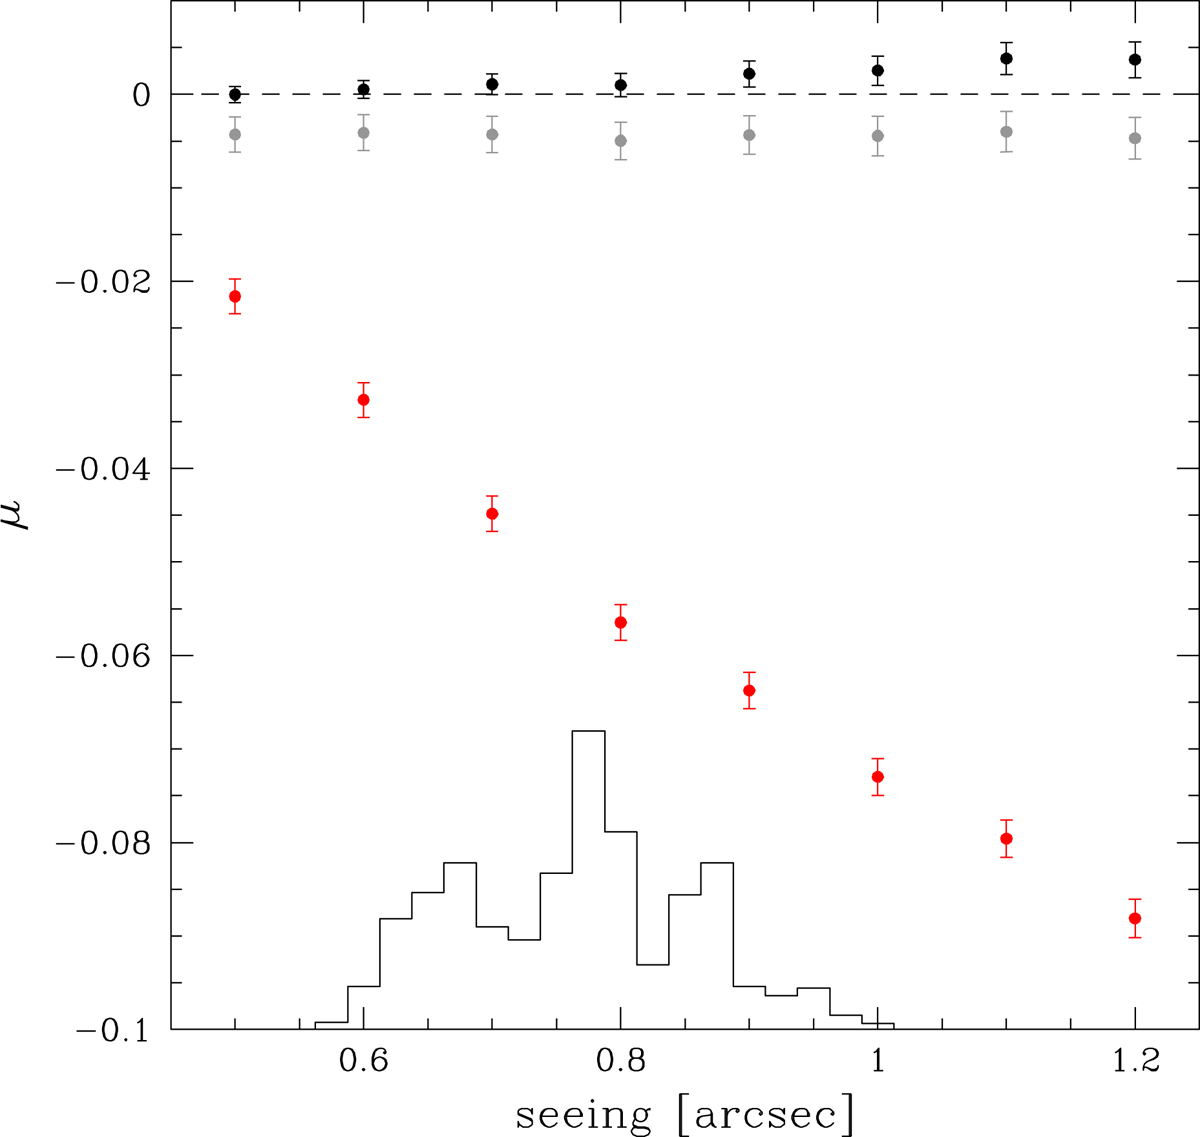
Multiplicative bias μ as a function of seeing for simulated galaxies with 20 < i < 22.5. The red points correspond to the KSB estimates, which are significantly biased and depend upon image quality. The corrected biases are shown as grey (per-galaxy bias correction) and black (seeing-averaged bias correction) points. The histogram shows the seeing distribution for the CFHTLS W3 data.
Current usage metrics show cumulative count of Article Views (full-text article views including HTML views, PDF and ePub downloads, according to the available data) and Abstracts Views on Vision4Press platform.
Data correspond to usage on the plateform after 2015. The current usage metrics is available 48-96 hours after online publication and is updated daily on week days.
Initial download of the metrics may take a while.