Fig. 4.
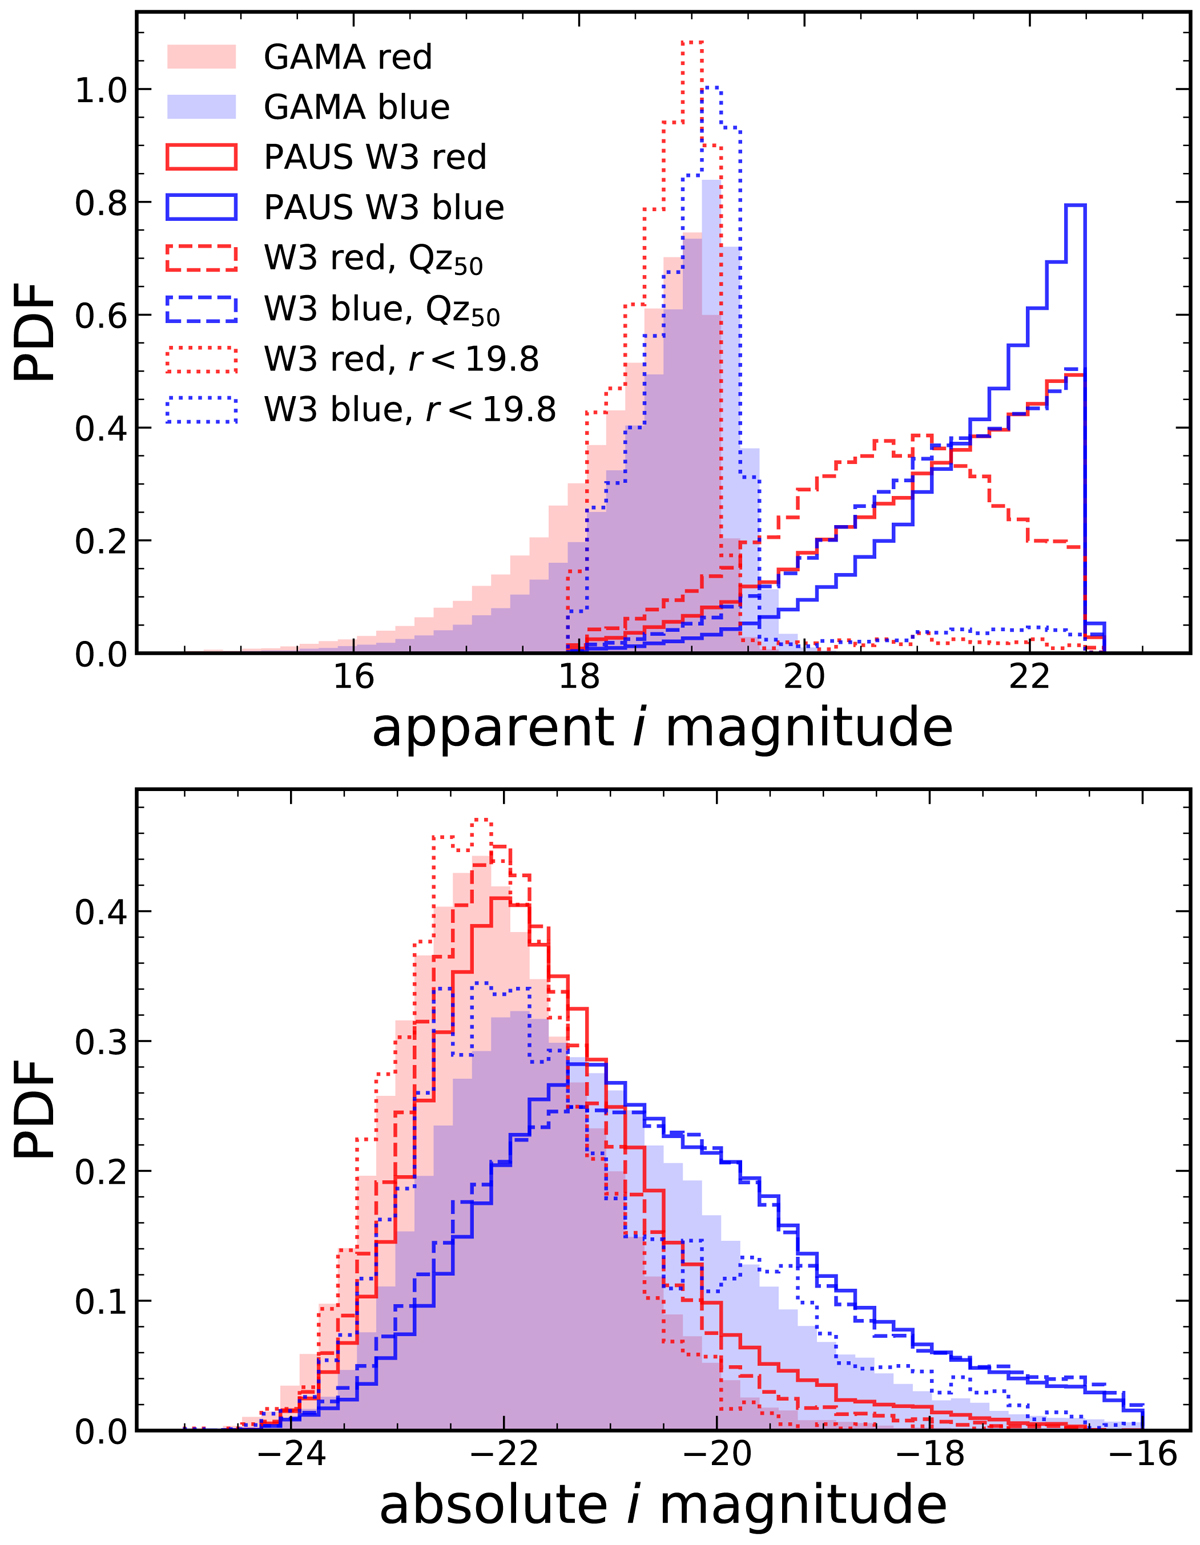
Apparent (observed) and absolute i-band magnitudes of galaxies in PAUS (solid lines; limited to 0.1 < zphot < 0.8 and apparent i > 18) and GAMA (shading), with colours reflecting the (LEPHARE) red/blue selections displayed in Fig. 3 (top-left panel). We also display the magnitude distributions for 2 subsets of PAUS: (i) the best 50% selected on photo-z quality parameter Qz (dashed), and (ii) with apparent r < 19.8 (dotted) – approximately matching the GAMA flux-limit. Each histogram is individually normalised to unit area under the curve. Whilst the red galaxies in PAUS/GAMA are fairly similarly distributed in absolute i-band magnitude, PAUS exhibits a higher fraction of intrinsically faint blue galaxies. PAUS absolute magnitudes shown here are those computed using LEPHARE.
Current usage metrics show cumulative count of Article Views (full-text article views including HTML views, PDF and ePub downloads, according to the available data) and Abstracts Views on Vision4Press platform.
Data correspond to usage on the plateform after 2015. The current usage metrics is available 48-96 hours after online publication and is updated daily on week days.
Initial download of the metrics may take a while.