Fig. 3.
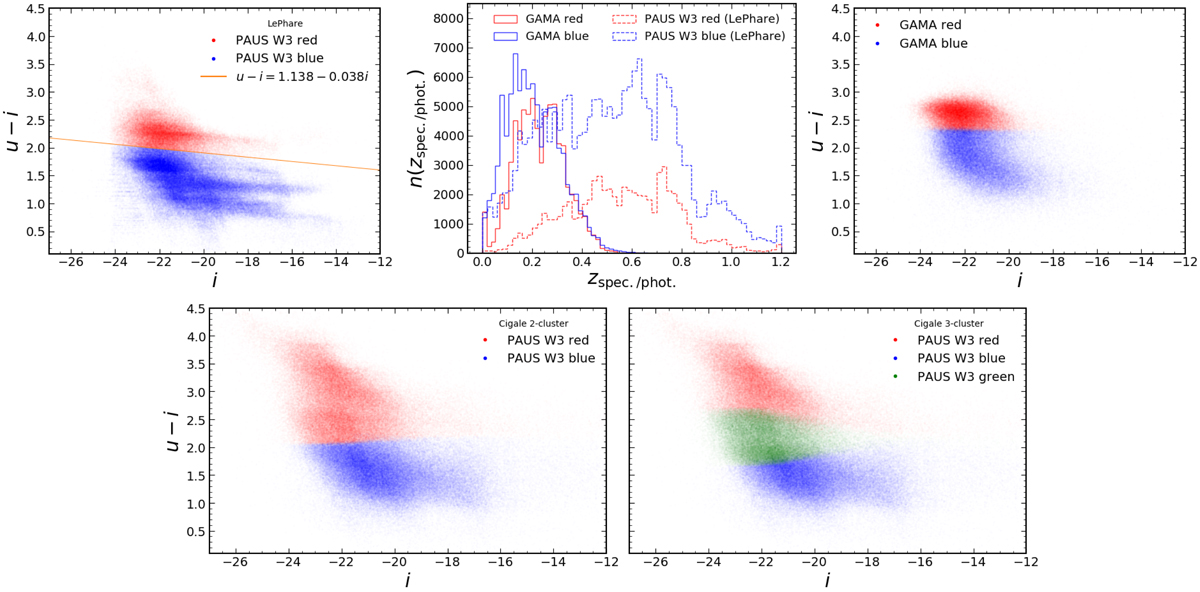
Top-left: absolute rest-frame colour u − i vs. i magnitude for PAUS galaxies in the W3 area. These rest-frame magnitudes were derived for CFHTLenS (Erben et al. 2013) using the LEPHARE software package (Arnouts et al. 1999; Ilbert et al. 2006). We define the red sequence as those galaxies for whom u − i > 1.138 − 0.038i, as indicated by the orange line. Top-middle: spectroscopic redshift distribution of galaxies in GAMA, and photo-z distribution of PAUS W3, coloured according to the cuts in the top-left and top-right panels – we note that PAUS samples are restricted to 0.1 < zphot. < 0.8 for our correlation function analysis. Top-right: absolute rest-frame colour u − i vs. i magnitude for GAMA equatorial galaxies from the final GAMA data-set (Liske et al. 2015). We followed Johnston et al. (2019) in setting the red/blue boundary at rest-frame g − r = 0.66, and plot the galaxies on the u − i vs. i plane for comparison with PAUS W3. Bottom: CIGALE-estimated absolute rest-frame u − i vs. i for PAUS W3, with 2-cluster (left) and 3-cluster (right) galaxy type classification.
Current usage metrics show cumulative count of Article Views (full-text article views including HTML views, PDF and ePub downloads, according to the available data) and Abstracts Views on Vision4Press platform.
Data correspond to usage on the plateform after 2015. The current usage metrics is available 48-96 hours after online publication and is updated daily on week days.
Initial download of the metrics may take a while.