Fig. 2.
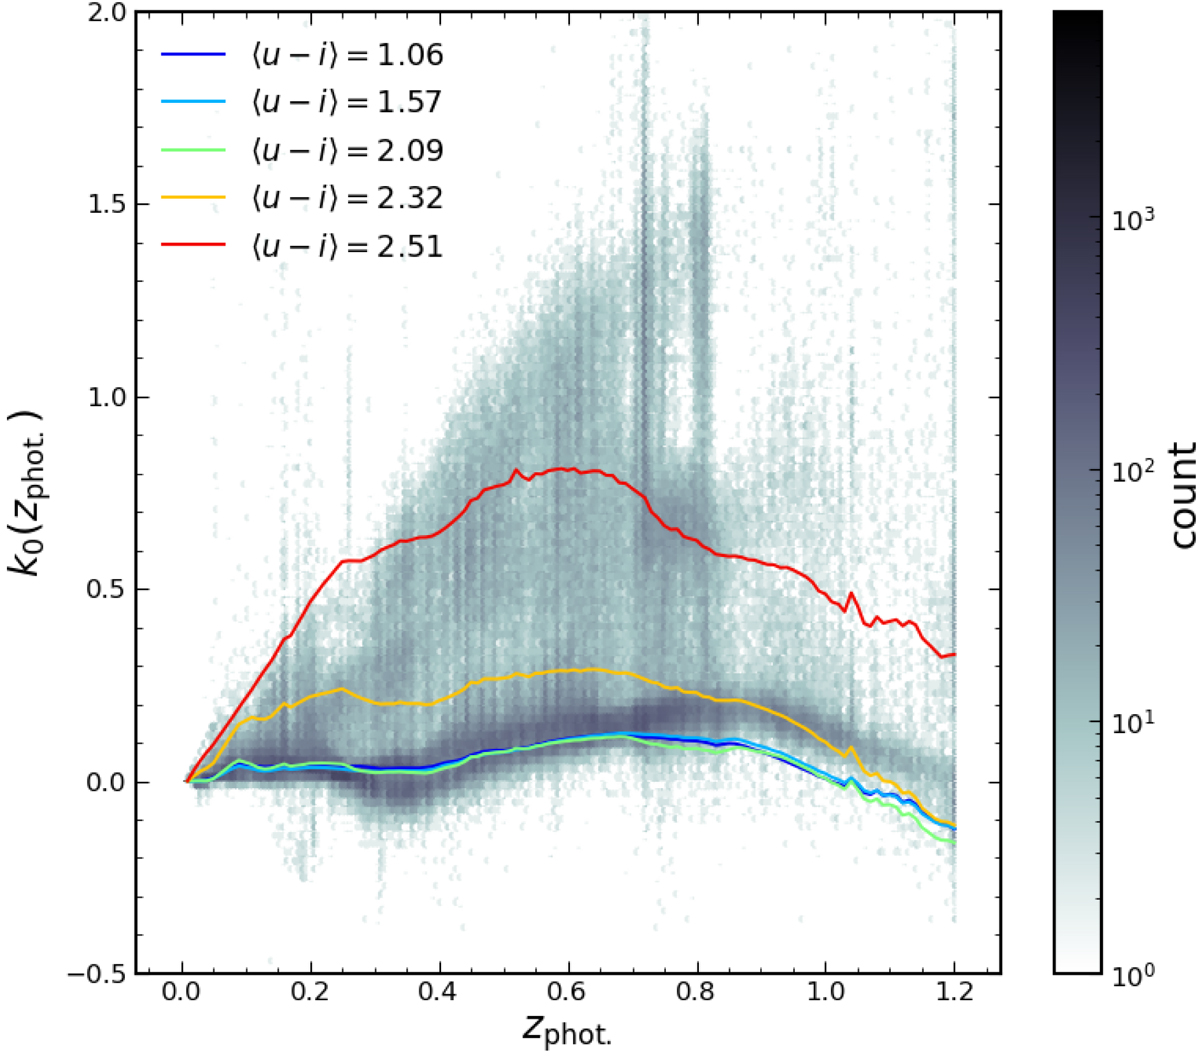
Hexagonally-binned 2D histogram of PAUS W3 galaxies’ i-band k-corrections from redshift z (x-axis) to z = 0 – we assembled these by redshifting each galaxy’s best-fit SED model over the entire z-range, and taking ratios (Eq. (1)) of fluxes to the z = 0 flux. Cells are coloured by the count of galaxies resident in each cell. Solid coloured lines give the running-medians of k0(z) for five rest-frame colour bins, for which the average colours ⟨u − i⟩ are given in the legend (absolute magnitudes estimated with LEPHARE).
Current usage metrics show cumulative count of Article Views (full-text article views including HTML views, PDF and ePub downloads, according to the available data) and Abstracts Views on Vision4Press platform.
Data correspond to usage on the plateform after 2015. The current usage metrics is available 48-96 hours after online publication and is updated daily on week days.
Initial download of the metrics may take a while.