Fig. A.4.
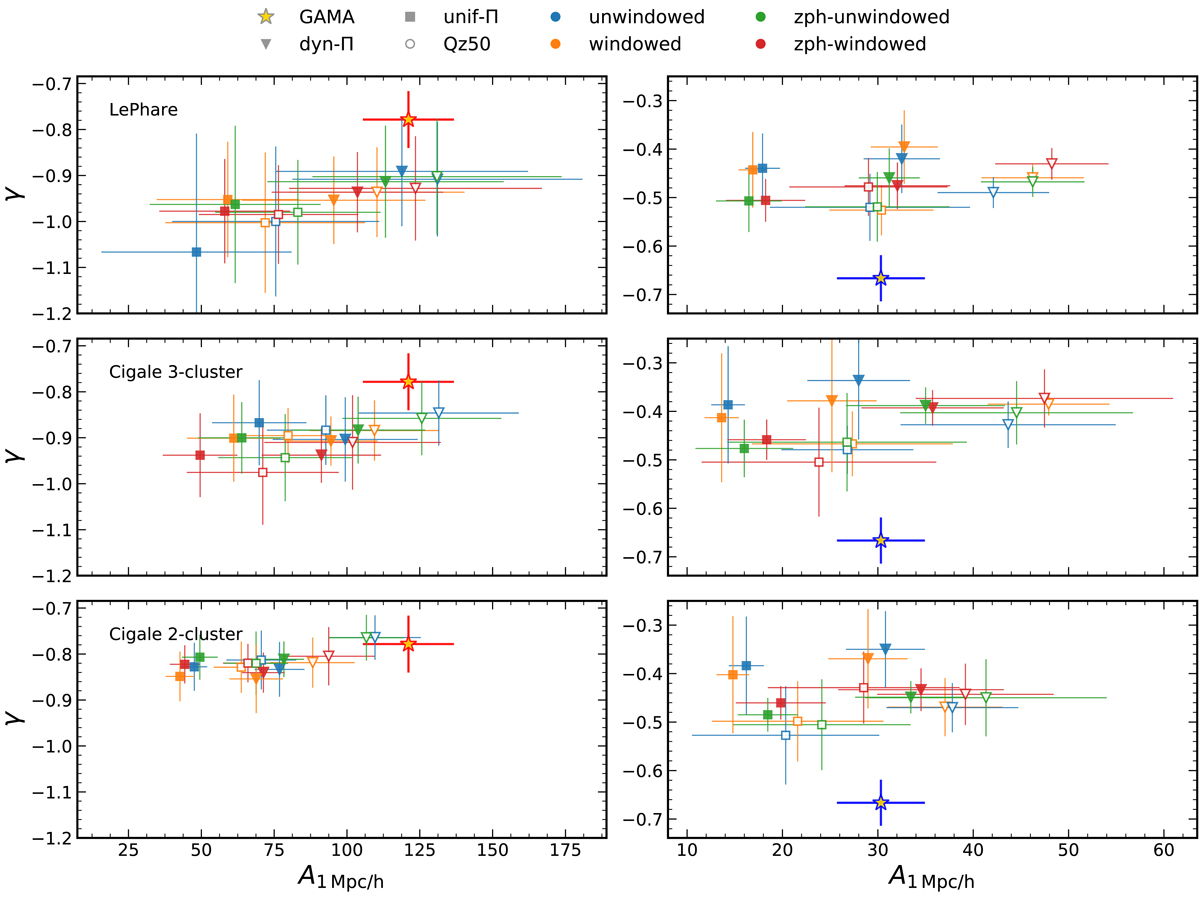
Comparison of projected clustering signal measurements in PAUS W3 and in spectroscopic GAMA data, summarised as fits of the simple, 2-parameter (amplitude A at rp = 1 h−1 Mpc, and slope γ) power law given by Eq. (A.1). Fits are made via the non-linear least squares method, in the range 0.1 < rp < 18 h−1 Mpc, and using full jackknife covariances (Sect. 4.3). All measured clustering signals feature heavily correlated rp-scales, sometimes resulting in poor goodness-of-fit, thus these points should be taken with moderation. Red (blue) galaxy correlations are shown in the left-hand (right-hand) column, with GAMA correlations given by gold stars with red (blue) outlines. PAUS correlations from each of our various configurations (changing Π-binning, randoms and photo-z selection) are denoted by markers and colours, as indicated by the legend.
Current usage metrics show cumulative count of Article Views (full-text article views including HTML views, PDF and ePub downloads, according to the available data) and Abstracts Views on Vision4Press platform.
Data correspond to usage on the plateform after 2015. The current usage metrics is available 48-96 hours after online publication and is updated daily on week days.
Initial download of the metrics may take a while.