Fig. A.3.
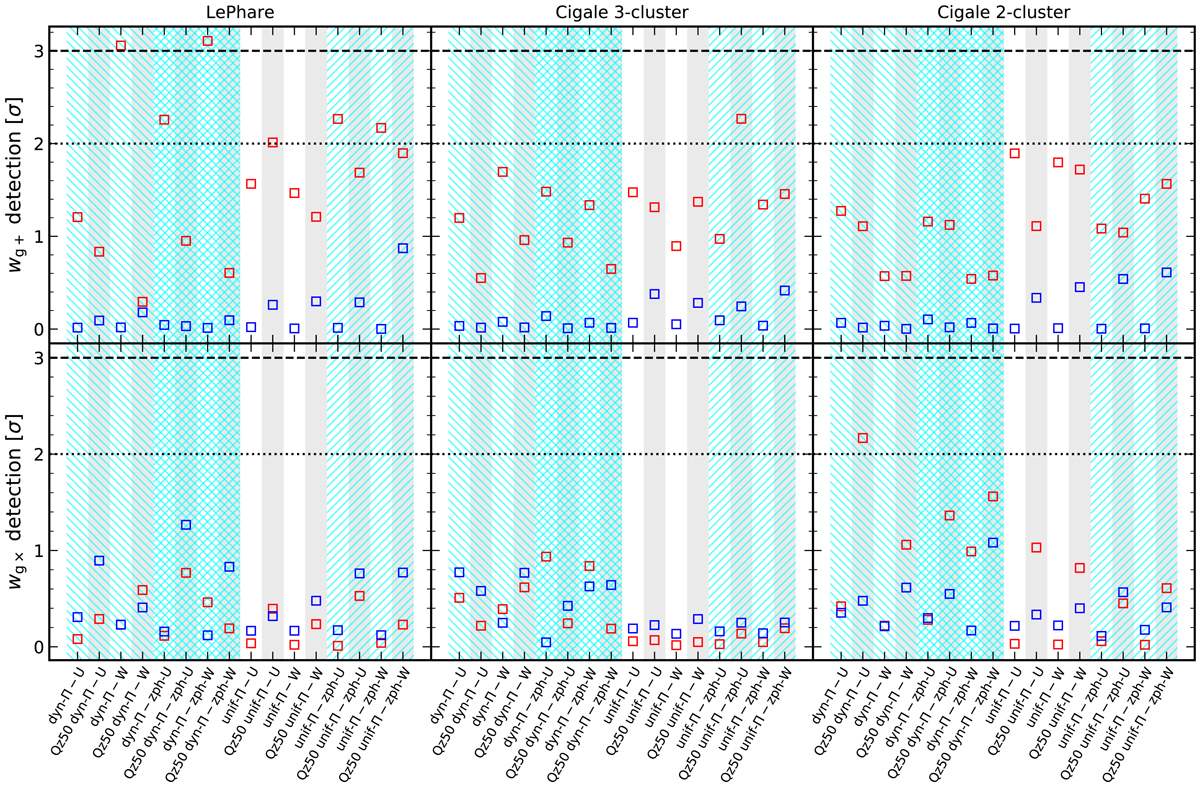
Summary of the significance of projected intrinsic alignment signal detection (given as xσ) in PAUS W3, with radial alignment component wg+ on the top row and cross-component (systematics-test) wg× on the bottom. Significances are computed in the range 0.1 < rp < 18 h−1 Mpc using full jackknife covariances (Sect. 4.3). Red and blue galaxy correlations are denoted by marker colours. The 3 columns show results for our different schemes of sample colour-splitting. Labels on the x-axis give the remaining specifics of each correlation configuration; ‘U’ (‘W’) denotes unwindowed (windowed) randoms. For ease of comparison, cyan forward-slash hatching indicates setups using zph-randoms (Sect. 3.3), and back-slashes indicate dynamic Π-binning (as opposed to uniform binning; no back-slashes). Grey shading denotes correlations measured on the best 50% of galaxies by photo-z quality (selected on the Qz parameter). We mark confidence levels 2σ and 3σ with horizontal lines. One sees that several correlation configurations yield red galaxy alignment signals reaching ∼2 − 3σ in significance. We make no significant detections of blue galaxy alignments, or systematics-test correlations, in the PAUS W3 data.
Current usage metrics show cumulative count of Article Views (full-text article views including HTML views, PDF and ePub downloads, according to the available data) and Abstracts Views on Vision4Press platform.
Data correspond to usage on the plateform after 2015. The current usage metrics is available 48-96 hours after online publication and is updated daily on week days.
Initial download of the metrics may take a while.