Fig. A.1.
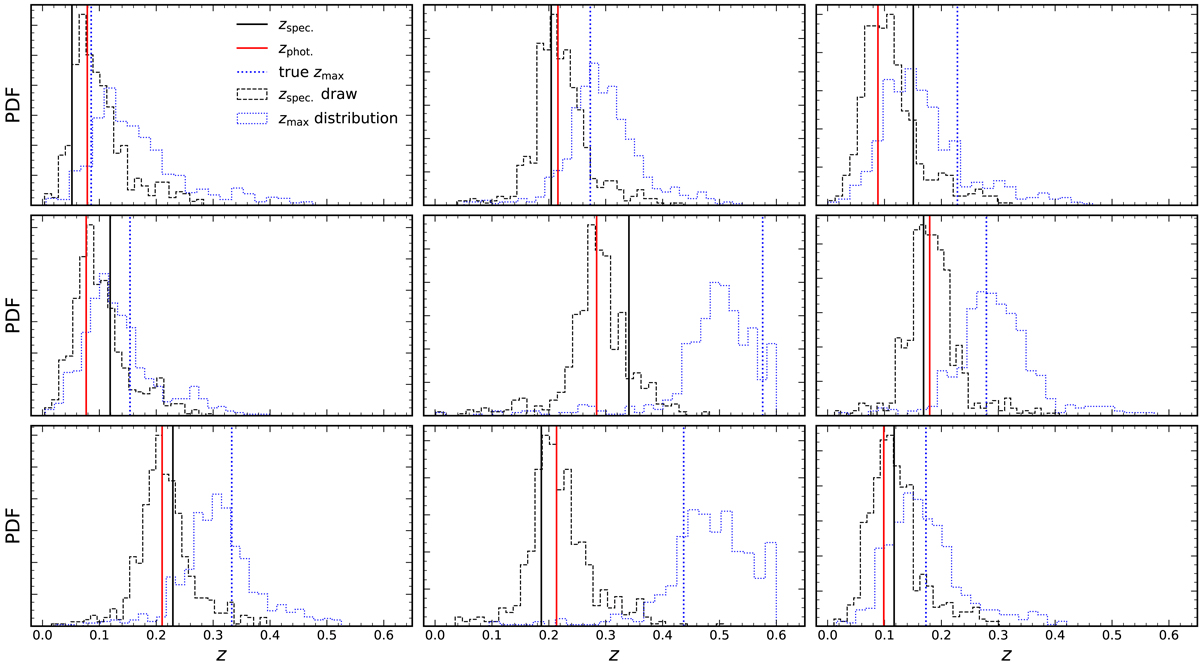
Artificial photometric (red vertical lines; Sect. 3.3), external spectroscopic (black vertical lines) and spectroscopically-calculated maximum (blue dotted vertical lines; Sect. 3.1) redshifts of 9 galaxies in GAMA. The realisations of GAMA spec-z, drawn from the conditional n(zspec. | zphot. ± 0.03) distribution surrounding each galaxy’s zphot., are displayed as black dashed histograms, and the corresponding zmax distribution is given in each panel as a blue dotted histogram. One sees that errors in photo-z (red vs. black vertical lines) and the corresponding inferred zmax (peaks of blue histograms vs. blue vertical lines) are compensated by the draws from n(zspec. | zphot.) and resulting zmax distributions.
Current usage metrics show cumulative count of Article Views (full-text article views including HTML views, PDF and ePub downloads, according to the available data) and Abstracts Views on Vision4Press platform.
Data correspond to usage on the plateform after 2015. The current usage metrics is available 48-96 hours after online publication and is updated daily on week days.
Initial download of the metrics may take a while.