Fig. 15.
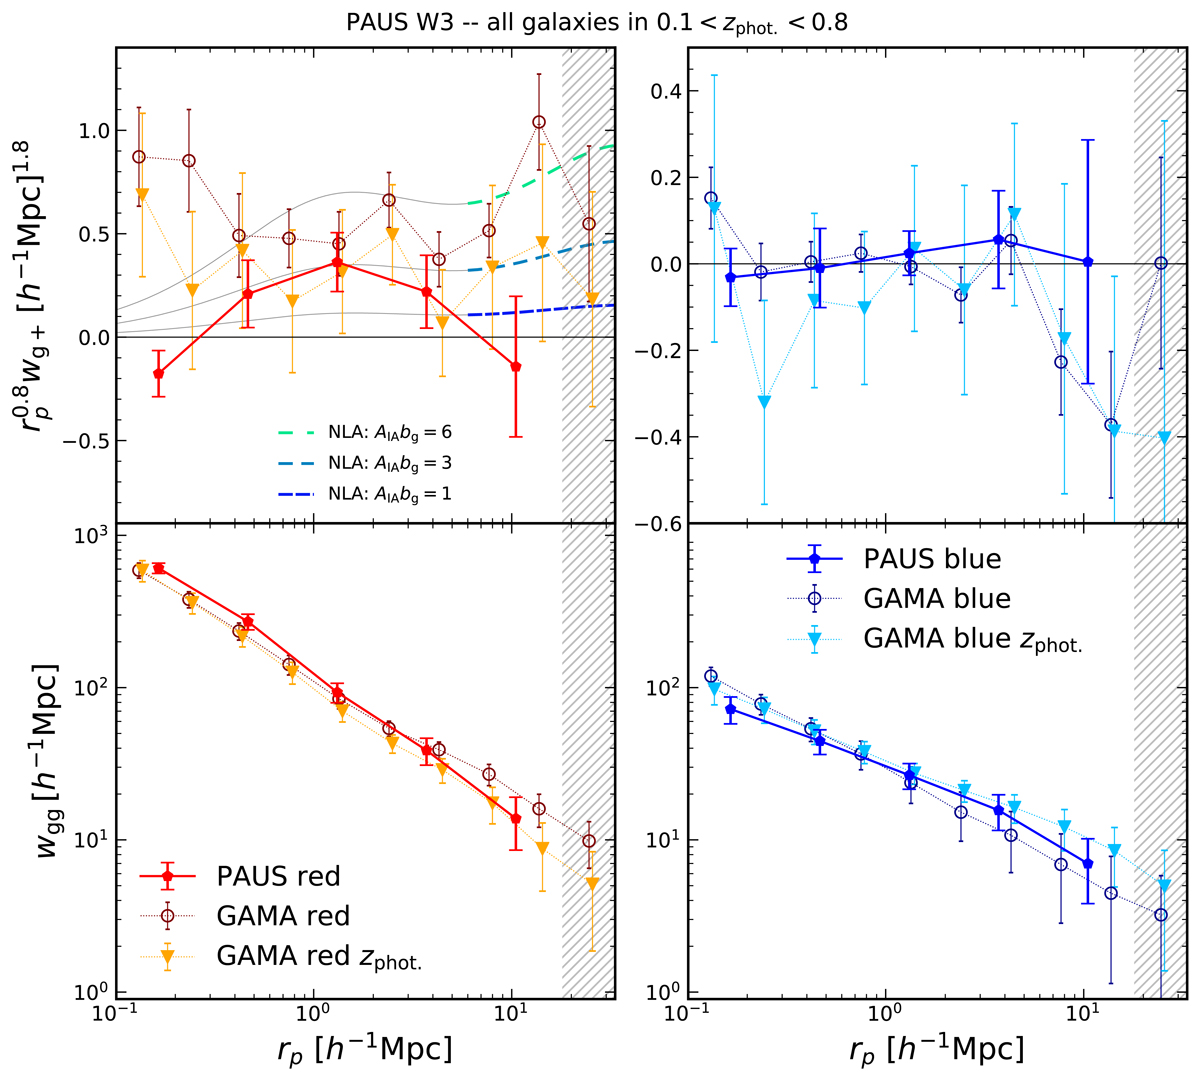
Projected position-shear (top) and position-position (bottom) correlations measured for red (left) and blue (right) galaxies in PAUS (filled pentagons) and GAMA (open circles and filled triangles). The PAUS correlations displayed here are for all galaxies (i.e. not selected according to Qz), split by colour according to LEPHARE, measured with zph-windowed randoms and dynamic Π-bins – see Appendix A for details on our choice here. Downward triangles display the correlations measured in GAMA using our mock photo-z, described in Sect. 3.3. Grey hatching indicates the larger scales where our PAUS W3 jackknife would yield unreliable errorbars (see Sect. 4.3).
Current usage metrics show cumulative count of Article Views (full-text article views including HTML views, PDF and ePub downloads, according to the available data) and Abstracts Views on Vision4Press platform.
Data correspond to usage on the plateform after 2015. The current usage metrics is available 48-96 hours after online publication and is updated daily on week days.
Initial download of the metrics may take a while.