Fig. 14.
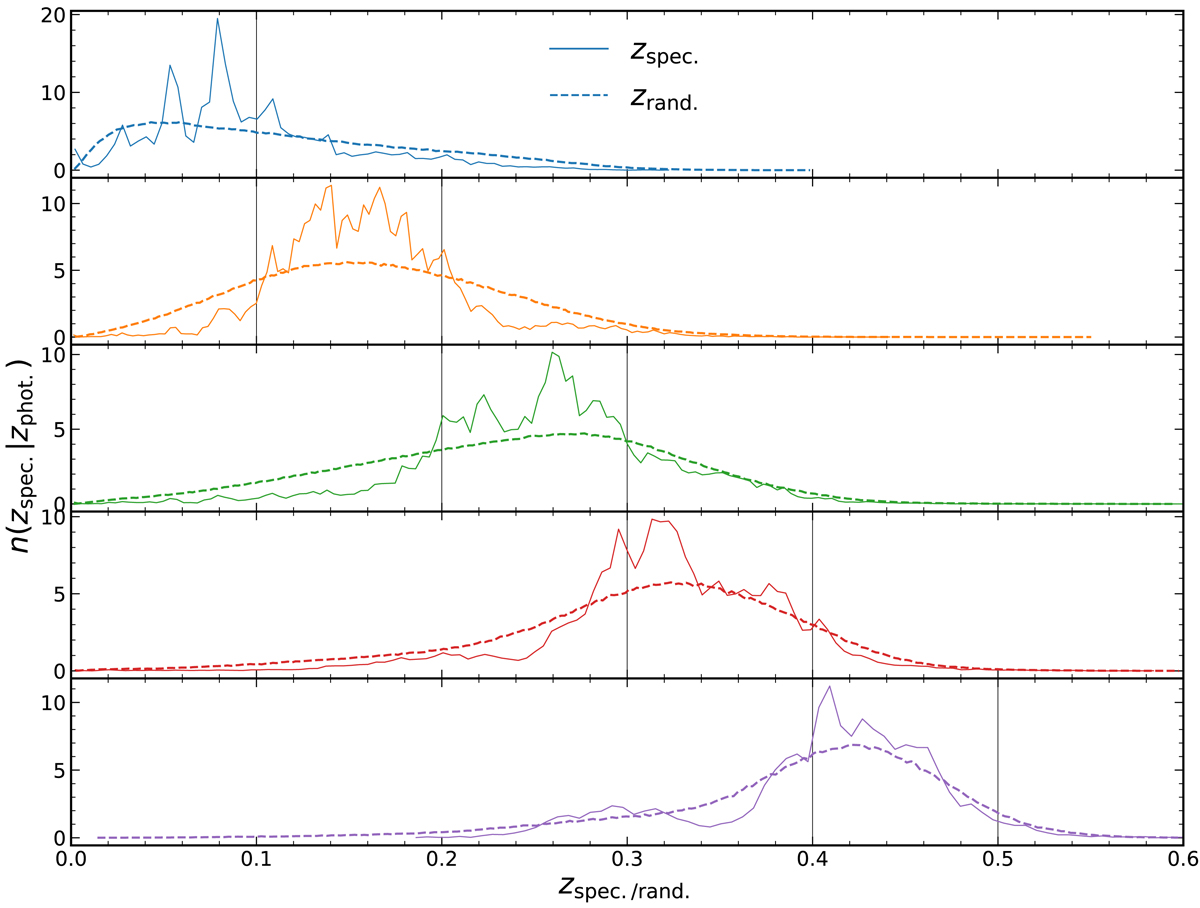
Spectroscopic redshift distributions of GAMA galaxies, binned by the mock photometric redshifts we describe in Sect. 3.3. Vertical black lines depict the bin-edges in zphot. and solid curves give the resulting n(zspec. | zphot.) for galaxies. Selecting only the clones of those binned galaxies, from our ‘zph-windowed’ GAMA randoms [σ = 5 × 10⁶ (h−1 Mpc)3], the randoms’ redshift distributions are then given by the dashed curves. One sees that our ‘zph-randoms’ [generated using samples from the n(zspec. | zphot.)’s centred on individual galaxies’ zphot. – see Sect. 3.3] are thus able to trace the artificial photo-z biases – for example, the secondary peak at z ∼ 0.3 in the final panel, which is captured by the tail of the randoms’ n(z). These curves are equivalent to horizontal bands in Fig. 13, summed over the y-axis.
Current usage metrics show cumulative count of Article Views (full-text article views including HTML views, PDF and ePub downloads, according to the available data) and Abstracts Views on Vision4Press platform.
Data correspond to usage on the plateform after 2015. The current usage metrics is available 48-96 hours after online publication and is updated daily on week days.
Initial download of the metrics may take a while.