Fig. 12.
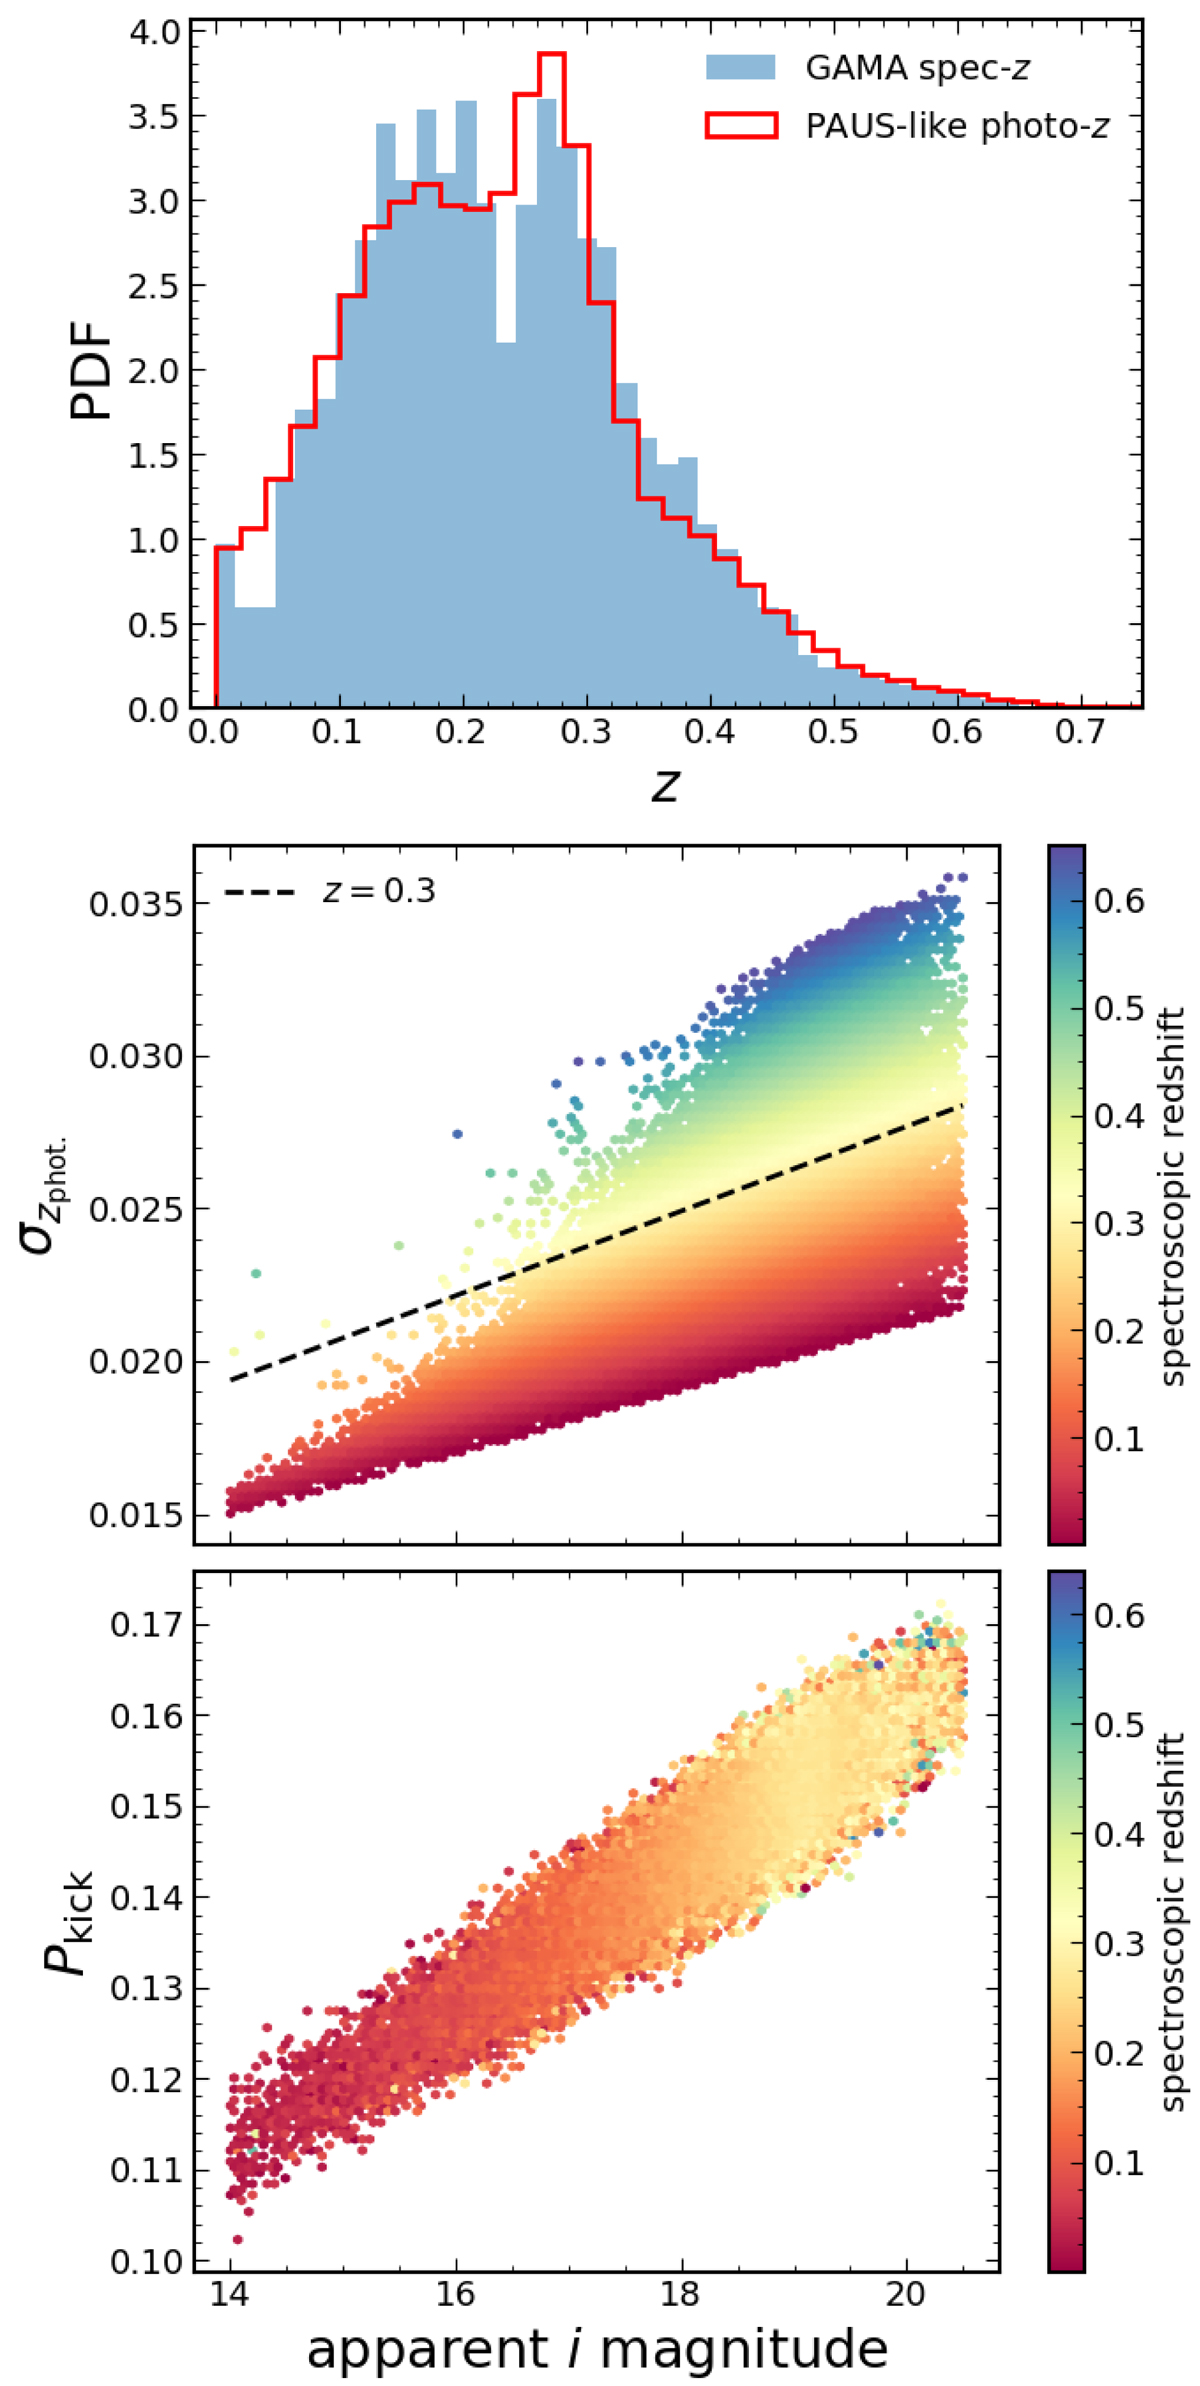
GAMA spectroscopic redshift distribution (top-panel; blue), overlaid with our approximately PAUS-like photometric redshift distribution (top-panel; red) – these photo-z are created by applying a redshift- and magnitude-dependent Gaussian scatter (middle-panel; Eq. (14)) to the spec-z, along with a probabilistic ‘kick’ (bottom-panel; Eq. (15)) to generate catastrophic outliers, and a manual relocation of some galaxies to zphot. ∼ 0.27 (see Sect. 3.3). Bottom-panels are hexagonally-binned 2D histograms, with cells coloured according to the mean GAMA spec-z of objects residing in each cell.
Current usage metrics show cumulative count of Article Views (full-text article views including HTML views, PDF and ePub downloads, according to the available data) and Abstracts Views on Vision4Press platform.
Data correspond to usage on the plateform after 2015. The current usage metrics is available 48-96 hours after online publication and is updated daily on week days.
Initial download of the metrics may take a while.