Fig. 10.
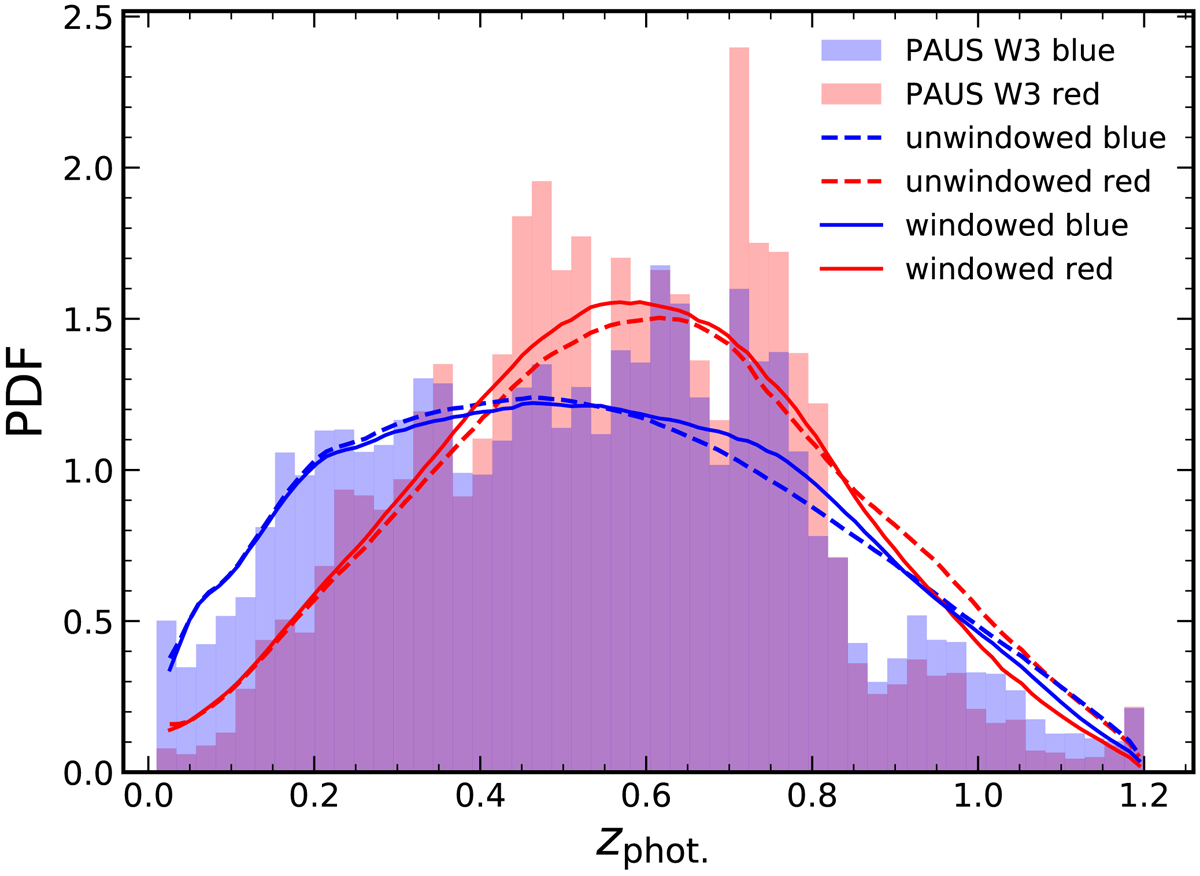
Photometric redshift distributions of PAUS W3 galaxies, split into (LEPHARE) red/blue samples (shaded histograms), along with the n(z) for red/blue clones in the windowed randoms (solid lines) and the unwindowed randoms (dashed lines). Randoms shown here are the ‘zph-randoms’ described in Sect. 3.3. Each histogram/curve is individually normalised to unit area.
Current usage metrics show cumulative count of Article Views (full-text article views including HTML views, PDF and ePub downloads, according to the available data) and Abstracts Views on Vision4Press platform.
Data correspond to usage on the plateform after 2015. The current usage metrics is available 48-96 hours after online publication and is updated daily on week days.
Initial download of the metrics may take a while.