Fig. 1.
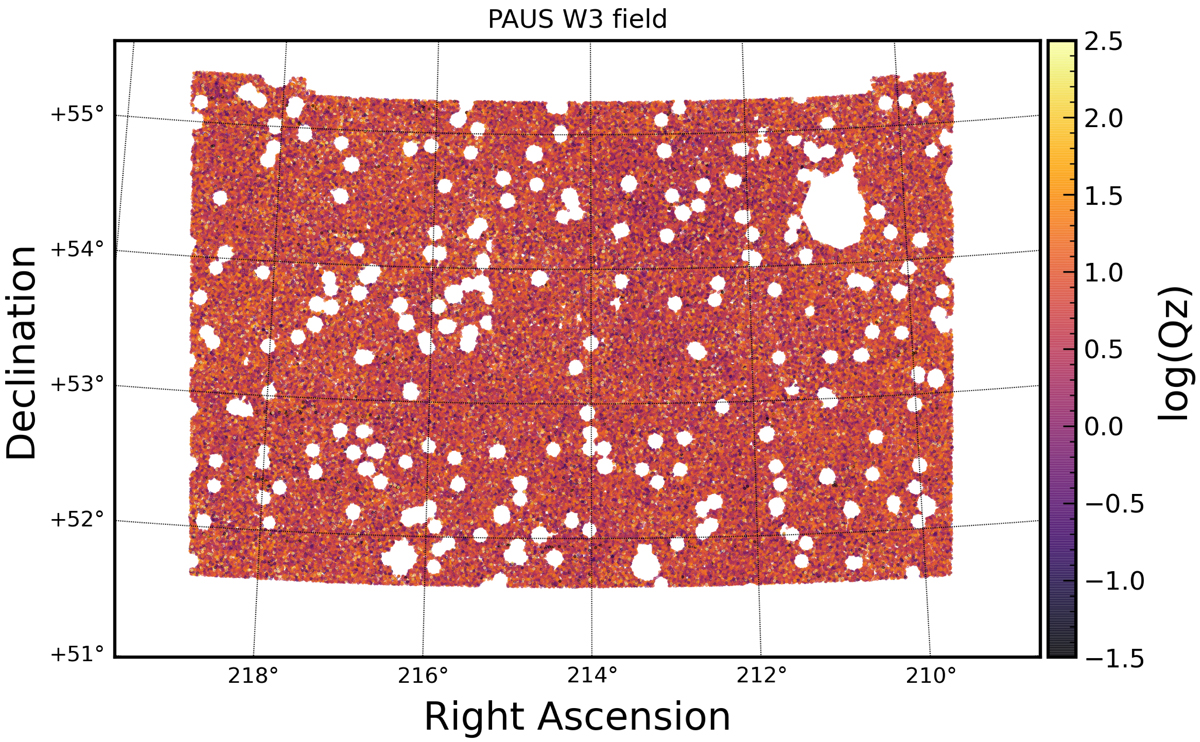
Distribution of galaxies in the PAUS W3 field, with points coloured according to the log of each galaxy’s Qz value – this quantity describes the quality of photometric redshift estimation (low Qz = high photo-z quality) through a combination of the goodness-of-fit of SED templates to narrow-band photometry, and the shape of the resulting redshift probability density function; see Sects. 2.2 and 2.6. Circular holes in the footprint correspond to masks around foreground stars, with the largest gap (top-right) covering the Pinwheel Galaxy (Messier 101).
Current usage metrics show cumulative count of Article Views (full-text article views including HTML views, PDF and ePub downloads, according to the available data) and Abstracts Views on Vision4Press platform.
Data correspond to usage on the plateform after 2015. The current usage metrics is available 48-96 hours after online publication and is updated daily on week days.
Initial download of the metrics may take a while.