Fig. D.1.
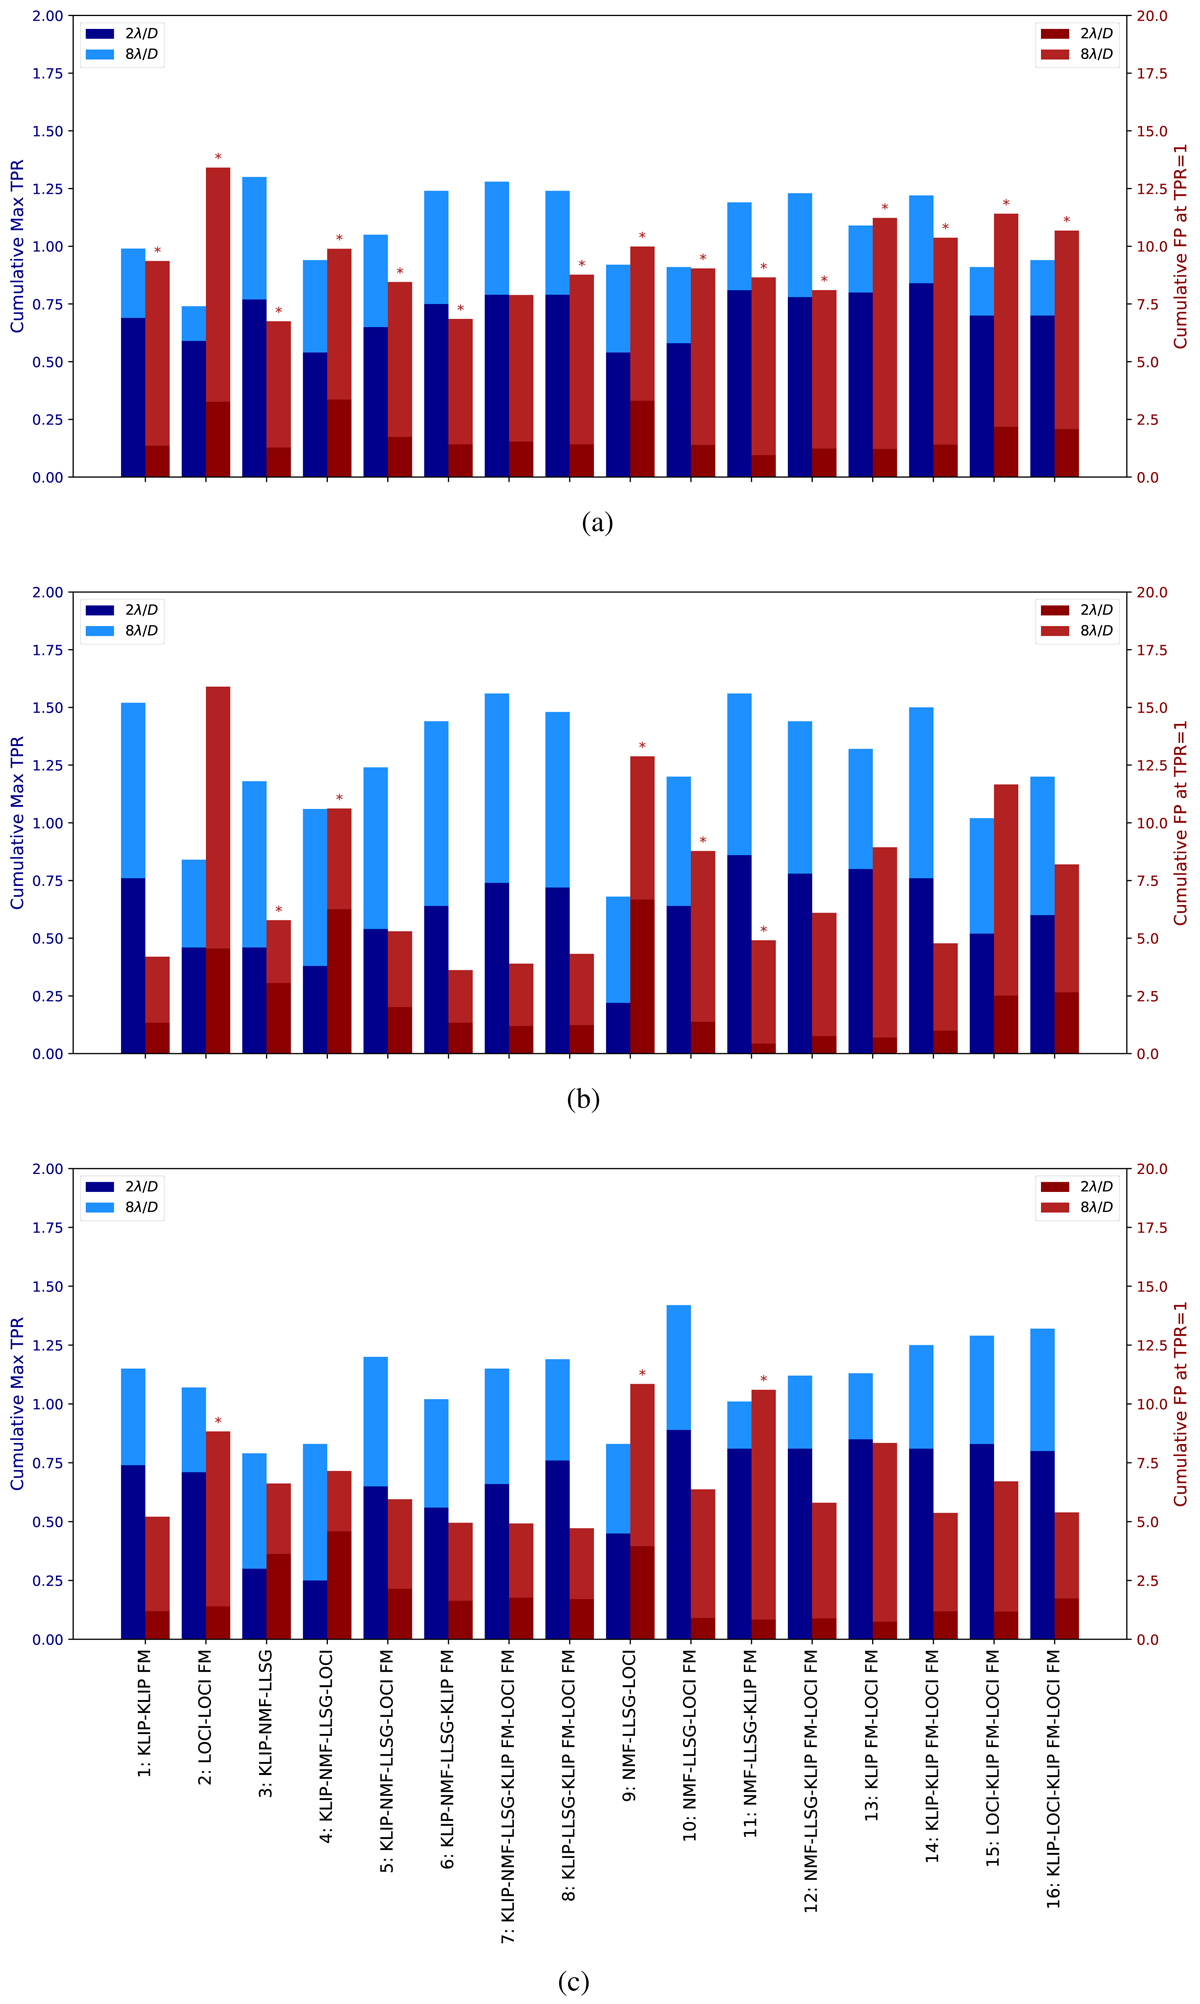
Cumulative maximum TPR reached without any FP (blue), and cumulative average number of FPs inside the entire frame at TPR = 1 (red) for 16 different combinations of PSF subtraction techniques used to generate the RSM map and two radial distances. The dark-coloured bars are obtained at a radial distance of 2λ/D while the light-coloured bars correspond to 8λ/D for, respectively, the NACO (top), SPHERE (middle), and LMIRCam (bottom) data sets. The asterisks for some values of FP at TPR = 1 indicate that a TPR of 1 has not been reached at a distance of 8λ/D and that the smallest probability threshold was chosen instead (highest TPR). A high performance for a combination of PSF subtraction techniques corresponds to a tall blue histogram alongside a short red histogram.
Current usage metrics show cumulative count of Article Views (full-text article views including HTML views, PDF and ePub downloads, according to the available data) and Abstracts Views on Vision4Press platform.
Data correspond to usage on the plateform after 2015. The current usage metrics is available 48-96 hours after online publication and is updated daily on week days.
Initial download of the metrics may take a while.