Fig. 11.
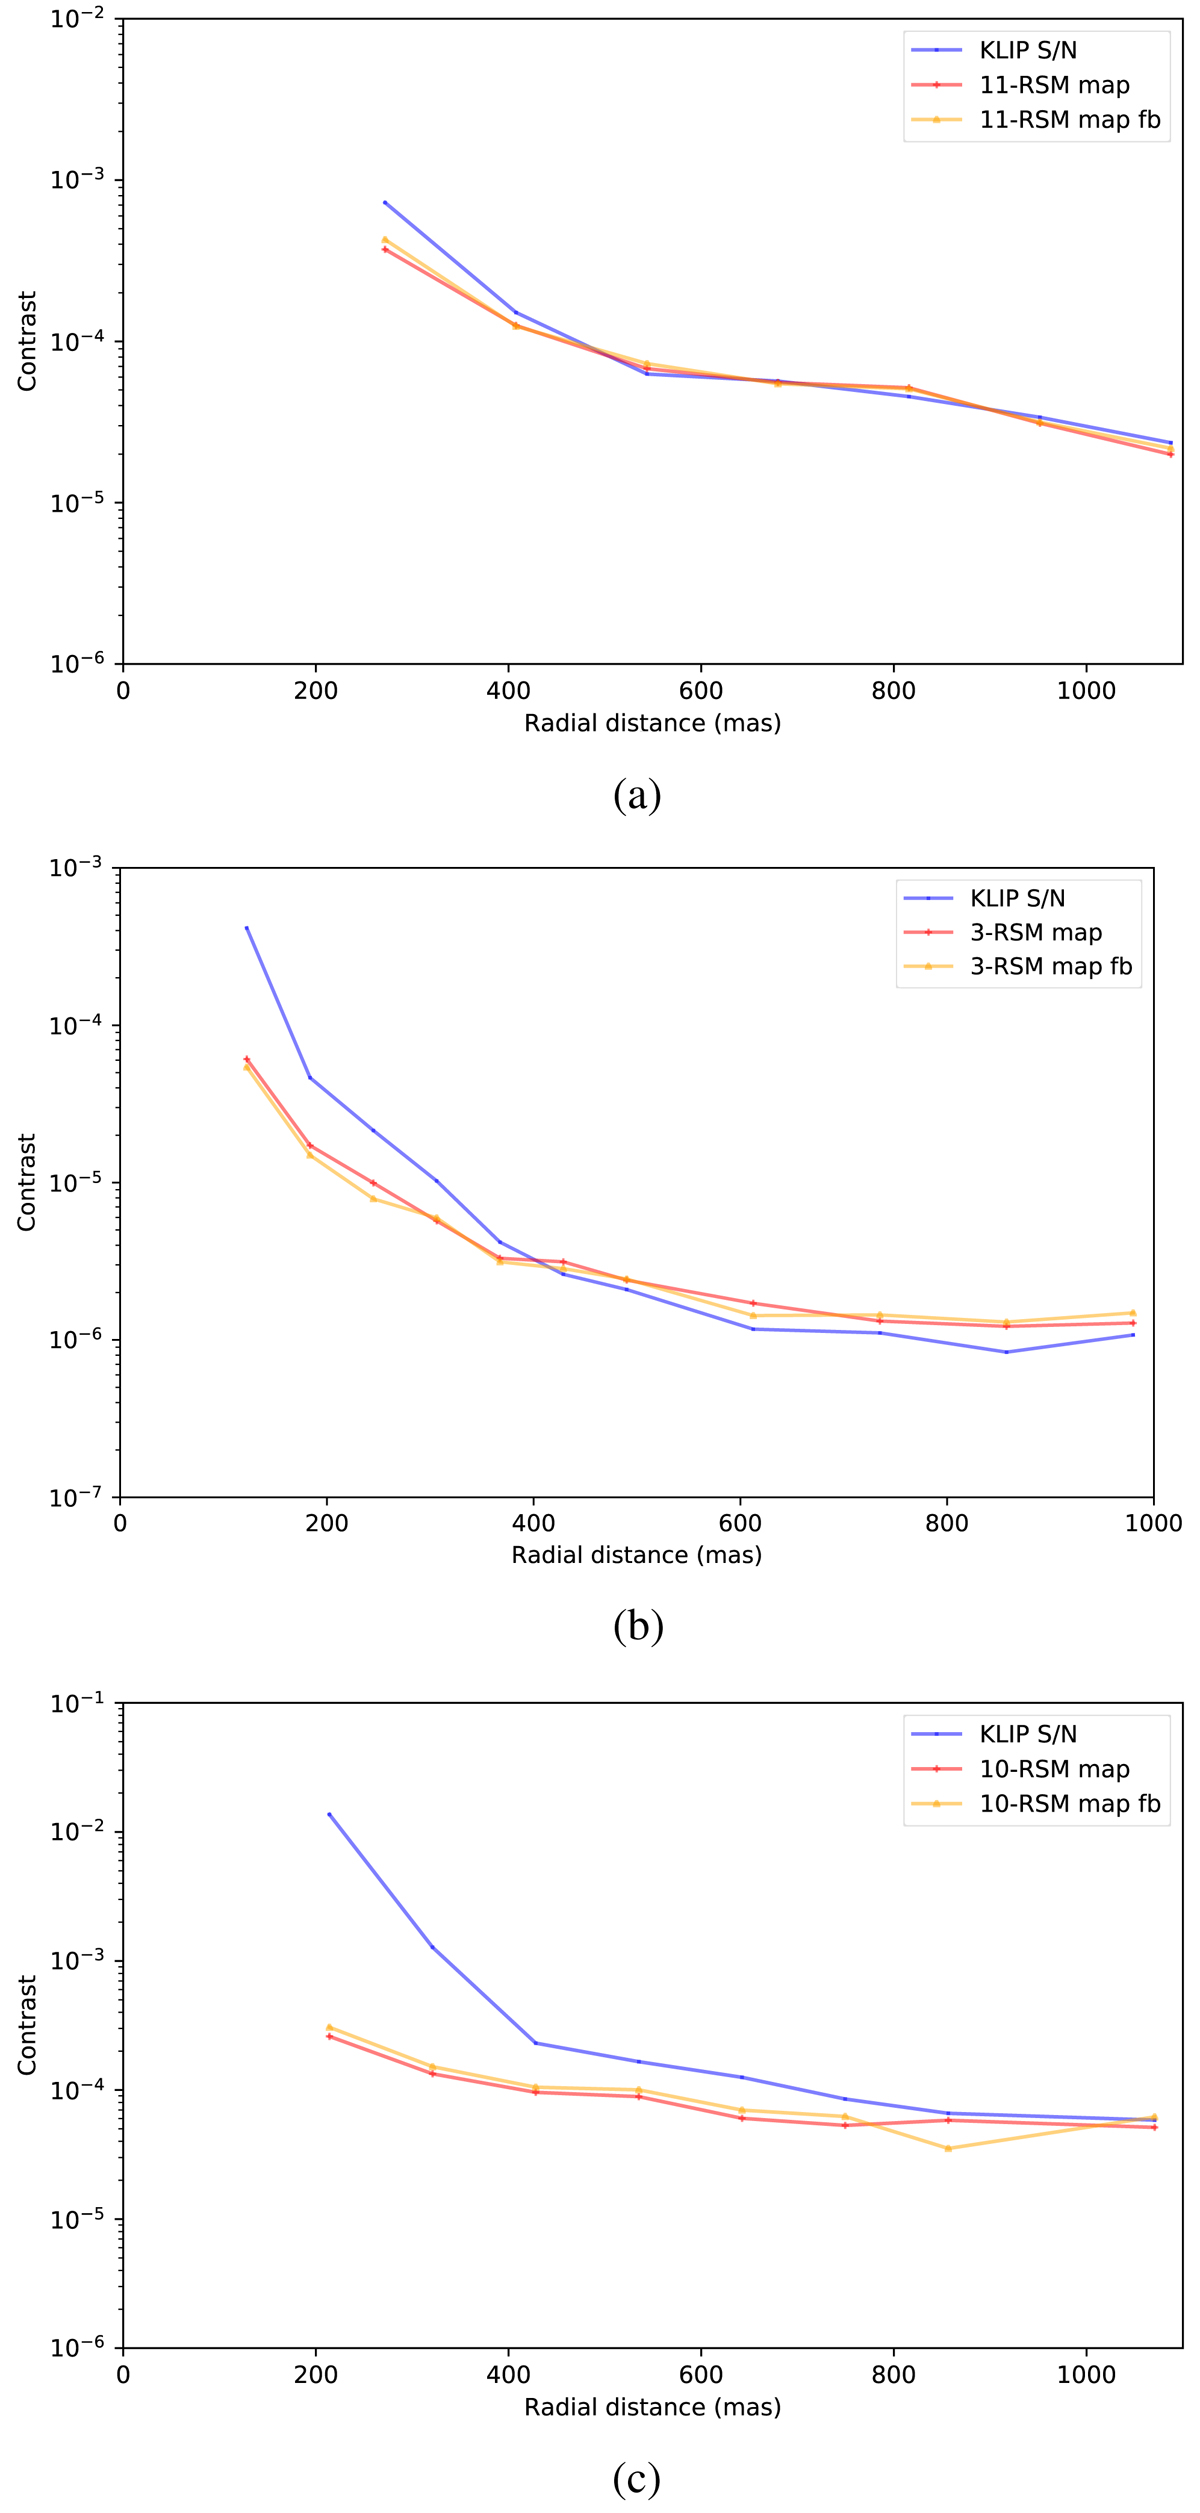
Contrast curves for the three data sets using the optimal combination of PSF subtraction techniques obtained in Sect. 5 (resp. 3, 11, and 10) with the region [2λ/D,16λ/D] considered for the SPHERE data set and the region [2λ/D,8λ/D] considered for the other two data sets to get the contrast in the first arcsecond. (a) NACO, (b) SPHERE, (c) LMIRCam.
Current usage metrics show cumulative count of Article Views (full-text article views including HTML views, PDF and ePub downloads, according to the available data) and Abstracts Views on Vision4Press platform.
Data correspond to usage on the plateform after 2015. The current usage metrics is available 48-96 hours after online publication and is updated daily on week days.
Initial download of the metrics may take a while.