Fig. 10.
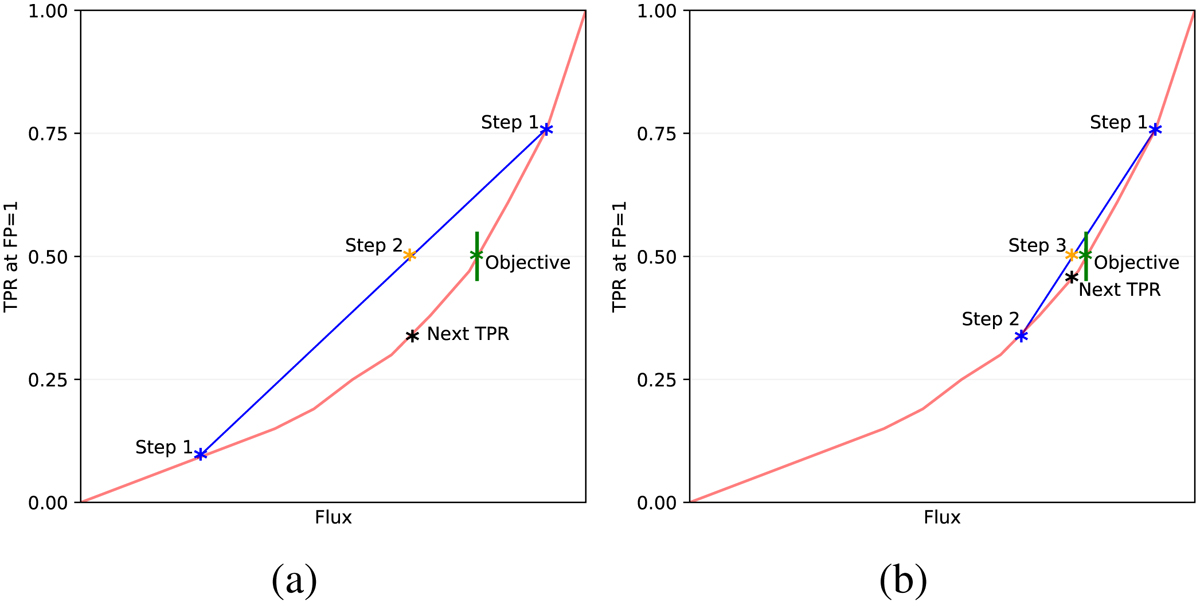
Procedure for the estimation of the contrast curve, the orange star corresponds to the linear interpolation, the black star to the corresponding TPR, the blue stars to the two previous estimations used for the linear interpolation and the green star to the flux corresponding to a TPR of 0.5. The red curve makes the link between the flux and the true positive rate in the case of a single false positive while the green line shows the tolerance’s interval of [0.45,0.55].
Current usage metrics show cumulative count of Article Views (full-text article views including HTML views, PDF and ePub downloads, according to the available data) and Abstracts Views on Vision4Press platform.
Data correspond to usage on the plateform after 2015. The current usage metrics is available 48-96 hours after online publication and is updated daily on week days.
Initial download of the metrics may take a while.