Fig. 9.
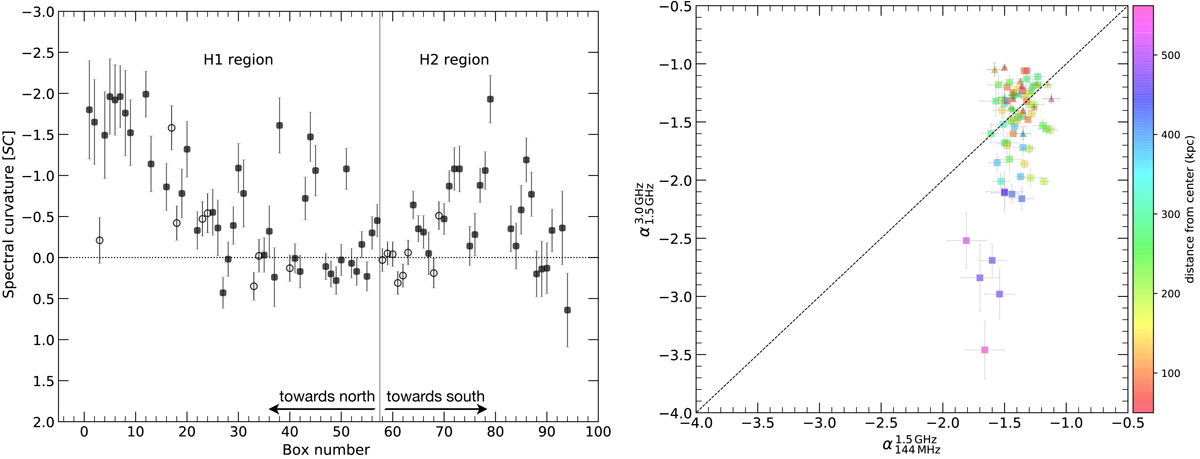
Curvature distribution and the radio color-color plot of the halo in MACS J0717.5+3745. Left: spectral curvature distribution across the radio halo from 144 MHz and 3.0 GHz. Cells with emission above 3σ in the radio images are considered. The open circles represent polarized emission in the halo region. The horizontal line indicates zero curvature. The solid gray line separates the H1 and H2 region of the halo. Points close to the gray line are extracted from the central part of the halo. The halo shows a clear trend of increasing curvature from center to the outermost regions. Right: radio color-color plot of the halo. The halo shows a clear negative curvature. The triangle represents polarized regions embedded in the halo region. Some of the data points lies significantly above the power law line, suggesting the possible superposition of the halo and the relic emission. The color bar shows the distance from the cluster center in kiloparsecs.
Current usage metrics show cumulative count of Article Views (full-text article views including HTML views, PDF and ePub downloads, according to the available data) and Abstracts Views on Vision4Press platform.
Data correspond to usage on the plateform after 2015. The current usage metrics is available 48-96 hours after online publication and is updated daily on week days.
Initial download of the metrics may take a while.