Fig. 8.
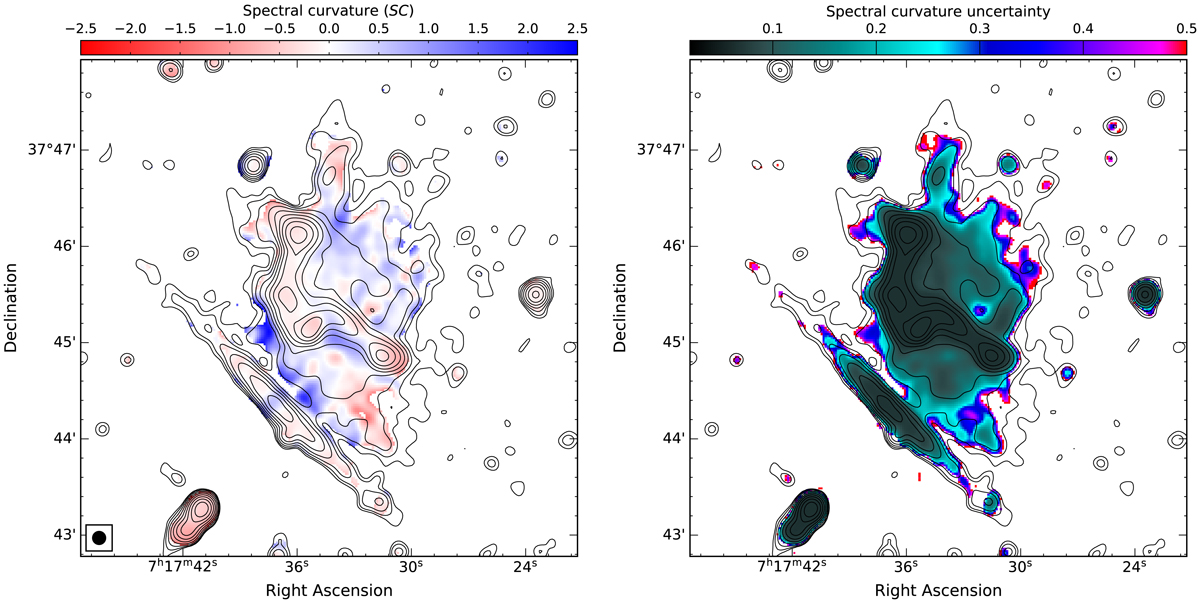
Spectral curvature map of the halo in MACS J0717.5+3745 at 8″ resolution. Left: four frequency spectral curvature map between 144 MHz and 5.5 GHz. The SC is negative for a convex spectrum. From the curvature map it is evident that the halo shows a clear curvature. There are also significant local variations in the curvature. Right: corresponding uncertainty between 1.5 and 5.5 GHz. Contour levels are drawn at [1, 2, 4, 8, …] × 4σrms, and are from the VLA L-band image.
Current usage metrics show cumulative count of Article Views (full-text article views including HTML views, PDF and ePub downloads, according to the available data) and Abstracts Views on Vision4Press platform.
Data correspond to usage on the plateform after 2015. The current usage metrics is available 48-96 hours after online publication and is updated daily on week days.
Initial download of the metrics may take a while.