Fig. 6.
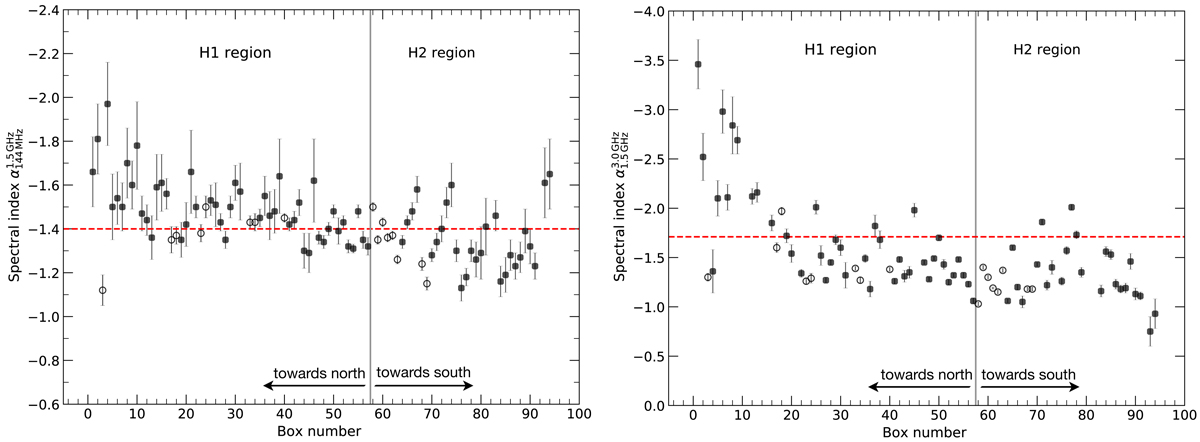
Spectral index distribution across the halo in MACS J0717.5+3745. Left: low-frequency spectral index ![]() . Right: high-frequency spectral index
. Right: high-frequency spectral index ![]() . The spectral indices were extracted in 8″ boxes, corresponding to a physical size of about 50 kpc. Open circles represent boxes within the halo where polarized emission occurs (cyan boxes in Fig. 3), filled circles denote unpolarized regions (red boxes in Fig. 3). The red horizontal line indicates the mean spectral index. The solid gray line separates the H1 and H2 region of the halo. Points close to the gray line are extracted from the central part of the halo. Systematic uncertainties in the flux-scale are included in the error bars. The spectral index tends to get steeper when moving away from the cluster center, in particular at higher frequencies and for the northern part of the halo.
. The spectral indices were extracted in 8″ boxes, corresponding to a physical size of about 50 kpc. Open circles represent boxes within the halo where polarized emission occurs (cyan boxes in Fig. 3), filled circles denote unpolarized regions (red boxes in Fig. 3). The red horizontal line indicates the mean spectral index. The solid gray line separates the H1 and H2 region of the halo. Points close to the gray line are extracted from the central part of the halo. Systematic uncertainties in the flux-scale are included in the error bars. The spectral index tends to get steeper when moving away from the cluster center, in particular at higher frequencies and for the northern part of the halo.
Current usage metrics show cumulative count of Article Views (full-text article views including HTML views, PDF and ePub downloads, according to the available data) and Abstracts Views on Vision4Press platform.
Data correspond to usage on the plateform after 2015. The current usage metrics is available 48-96 hours after online publication and is updated daily on week days.
Initial download of the metrics may take a while.