Fig. 5.
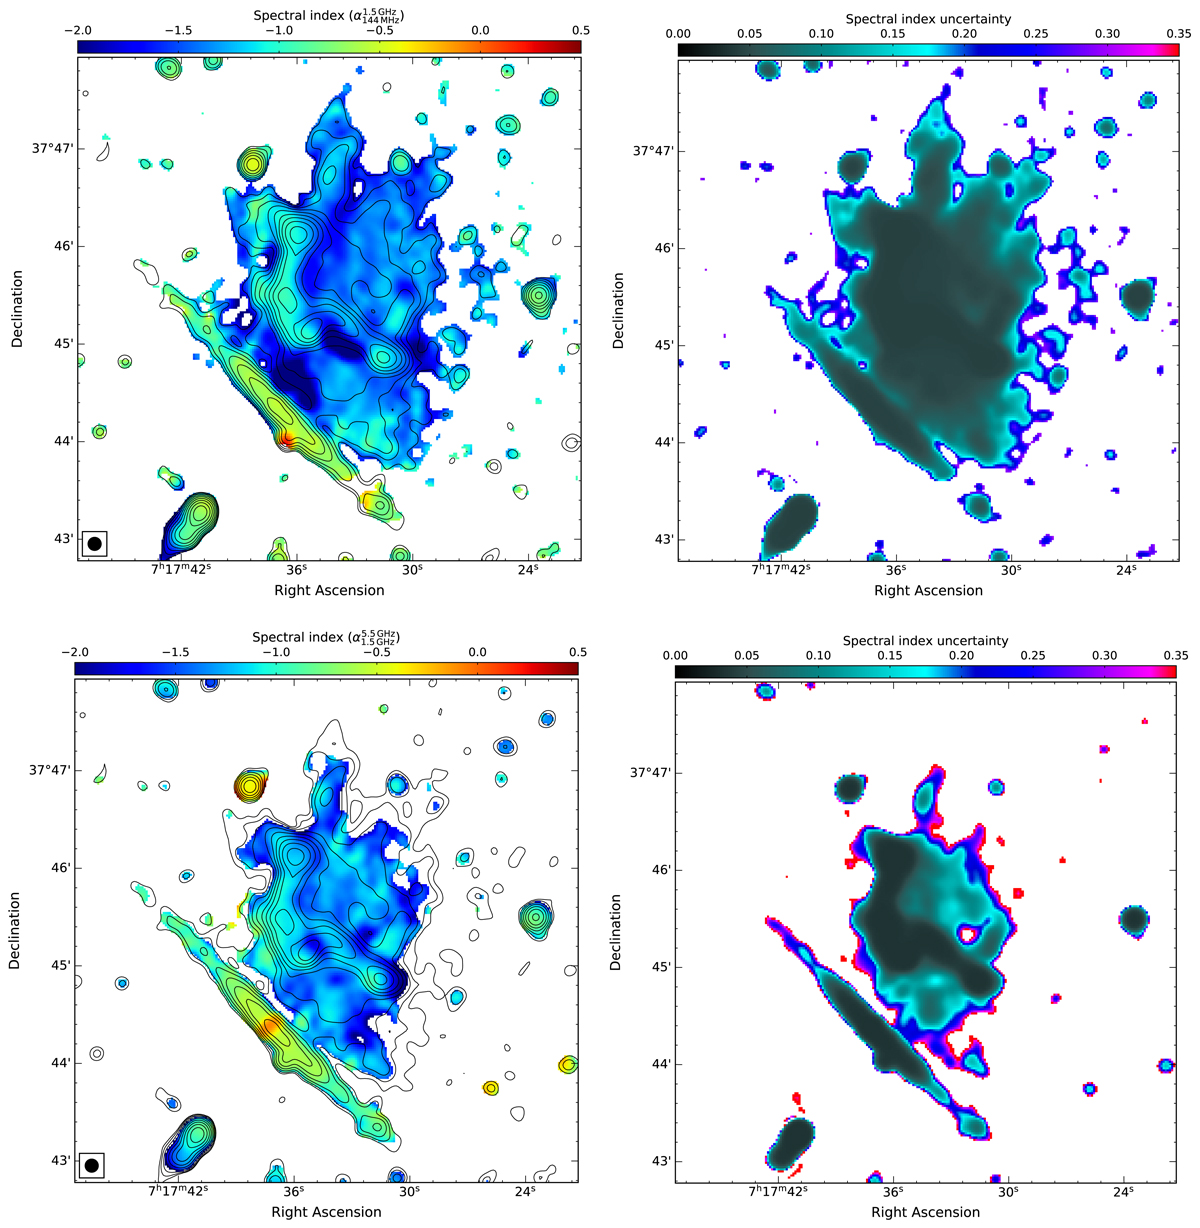
Spectral index maps of the halo in MACS J0717.5+3745 at 8″ resolution. Top: low-frequency spectral index, between 144 and 1500 MHz, with the corresponding spectral index uncertainty. Bottom: high-frequency spectral index between 1.5 and 5.5 GHz, with the corresponding spectral index uncertainty. Contour levels are drawn at [1, 2, 4, 8, …] × 4σrms and are from the VLA L-band image. The errors are based on the individual rms noise values in the maps and an absolute flux calibration uncertainty of 2.5%, 4%, and 10% for the S/C-band, L-band and LOFAR (144 MHz), respectively. The beam size is indicated in the bottom left corner of each image. It is evident that the spectral index variations across the halo are different at low and high frequencies.
Current usage metrics show cumulative count of Article Views (full-text article views including HTML views, PDF and ePub downloads, according to the available data) and Abstracts Views on Vision4Press platform.
Data correspond to usage on the plateform after 2015. The current usage metrics is available 48-96 hours after online publication and is updated daily on week days.
Initial download of the metrics may take a while.