Fig. 4.
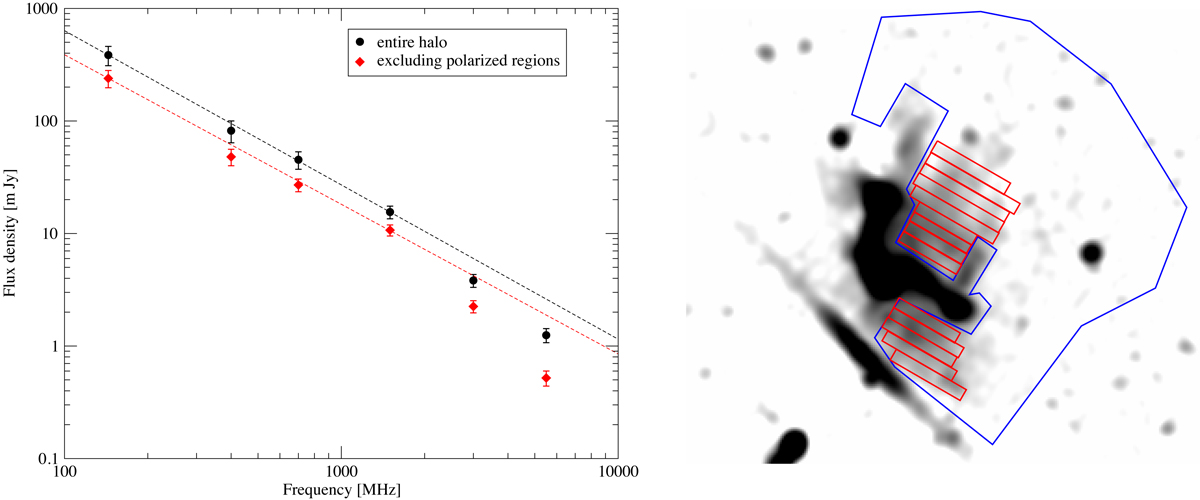
Left: integrated spectrum of the halo between 144 MHz and 5.5 GHz. Dashed lines are fitted (between 144 MHz and 1.5 GHz) straight power-laws. The overall spectrum of the halo cannot be described by a single power-law spectrum. The halo spectrum is curved and shows a high frequency spectral steepening above 1.5 GHz. Black and red points show the integrated spectrum of the halo obtained by including and excluding polarized patches, respectively, detected in the halo region. The polarized regions are shown with cyan boxes in the right panel of Fig. 3. Right: VLA 1.5 GHz image depicting the blue region where the integrated flux densities of the halo was measured (excluding source A). The flux densities are extracted from 15″ resolution images, created using uniform weighting with a uv-cut at 0.2 kλ. The red boxes have a width of 8″ used for extracting the radial spectral index profile across the halo.
Current usage metrics show cumulative count of Article Views (full-text article views including HTML views, PDF and ePub downloads, according to the available data) and Abstracts Views on Vision4Press platform.
Data correspond to usage on the plateform after 2015. The current usage metrics is available 48-96 hours after online publication and is updated daily on week days.
Initial download of the metrics may take a while.