Fig. 3.
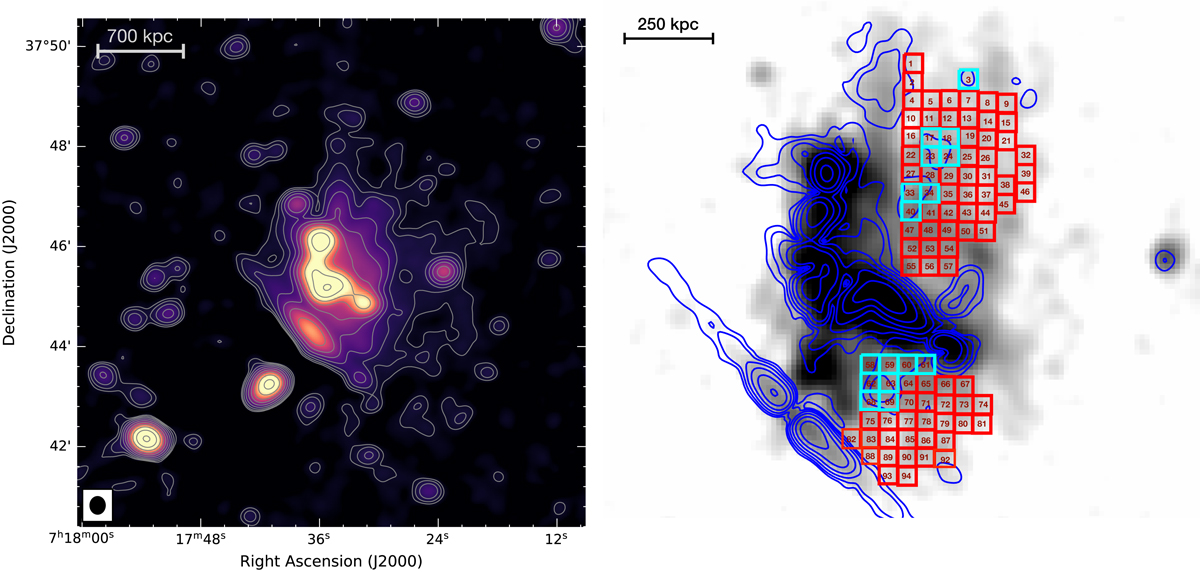
Left: low resolution (20″) VLA L-band image of MACS J0717+3745. The low surface brightness emission visible at 144 MHz, to the west of the cluster, is also clearly recovered in the VLA L-band image. Contour levels are drawn at [1, 2, 4, 8, …] × 3.0σrms, where σrms = 14 μJy beam−1. In this image, there is no region below −4σrms. The beam size is indicated in the bottom left corner of the image. Right: box distribution across the halo overlaid on the LOFAR total intensity map at 8″ resolution (gray) and polarization contours (blue) at 3 GHz. The cyan boxes show polarized patches found in the halo region. The width of the boxes used to extract the indices is 8″, corresponding to a physical size of about 50 kpc.
Current usage metrics show cumulative count of Article Views (full-text article views including HTML views, PDF and ePub downloads, according to the available data) and Abstracts Views on Vision4Press platform.
Data correspond to usage on the plateform after 2015. The current usage metrics is available 48-96 hours after online publication and is updated daily on week days.
Initial download of the metrics may take a while.