Fig. 2.
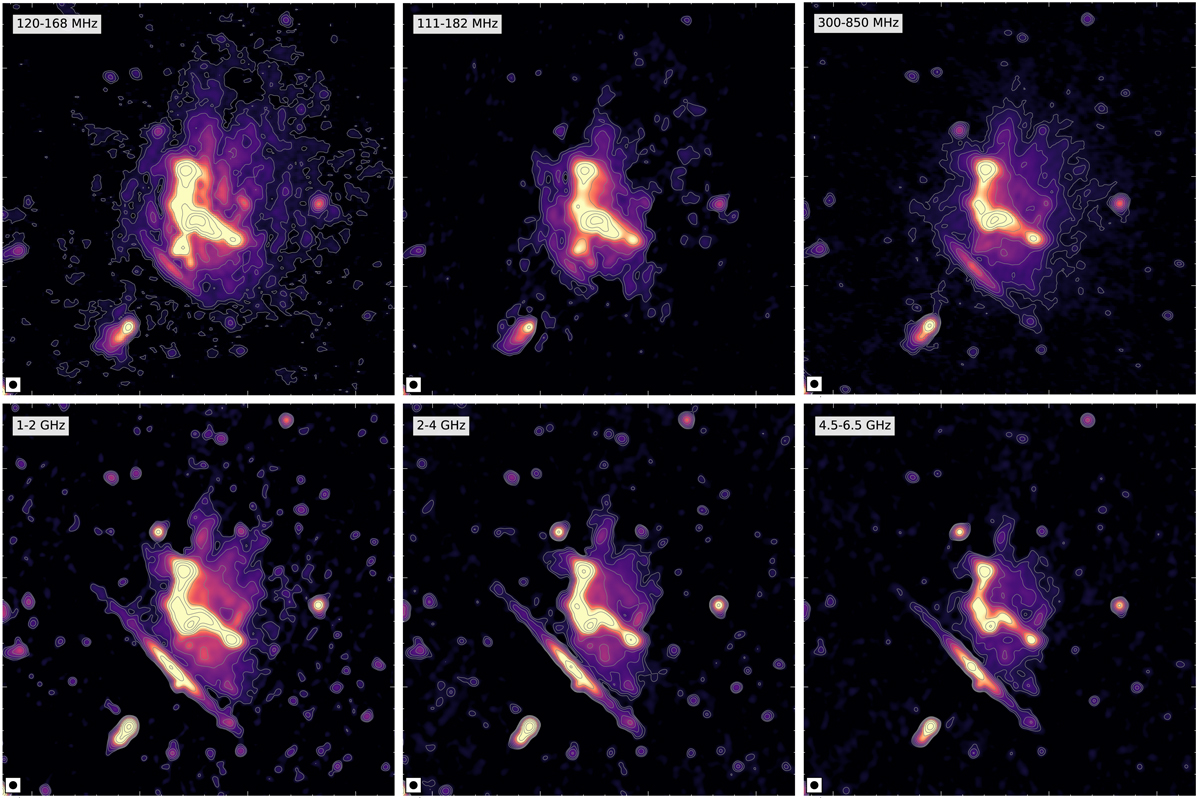
Comparison of the halo from 144 MHz to 5.5 GHz. All images are at created at a common 8″ resolution. Top-middle panel: (111−182 MHz) adopted from Bonafede et al. (2018). The colors in all images were scaled manually. It is evident that the halo emission is more extended toward low frequencies. Contour levels are drawn at [1, 2, 4, 8, …] × 3.0σrms, where σrms, 144 MHz = 82 μJy beam−1, σrms, 147 MHz = 130 μJy beam−1, σrms, 575 MHz = 23 μJy beam−1, σrms, 1.5 GHz = 7 μJy beam−1, σrms, 3.4 GHz = 3 μJy beam−1, and σrms, 5.5 GHz = 3.2 μJy beam−1. The beam sizes are indicated in the bottom left corner of the each image.
Current usage metrics show cumulative count of Article Views (full-text article views including HTML views, PDF and ePub downloads, according to the available data) and Abstracts Views on Vision4Press platform.
Data correspond to usage on the plateform after 2015. The current usage metrics is available 48-96 hours after online publication and is updated daily on week days.
Initial download of the metrics may take a while.