Fig. 12.
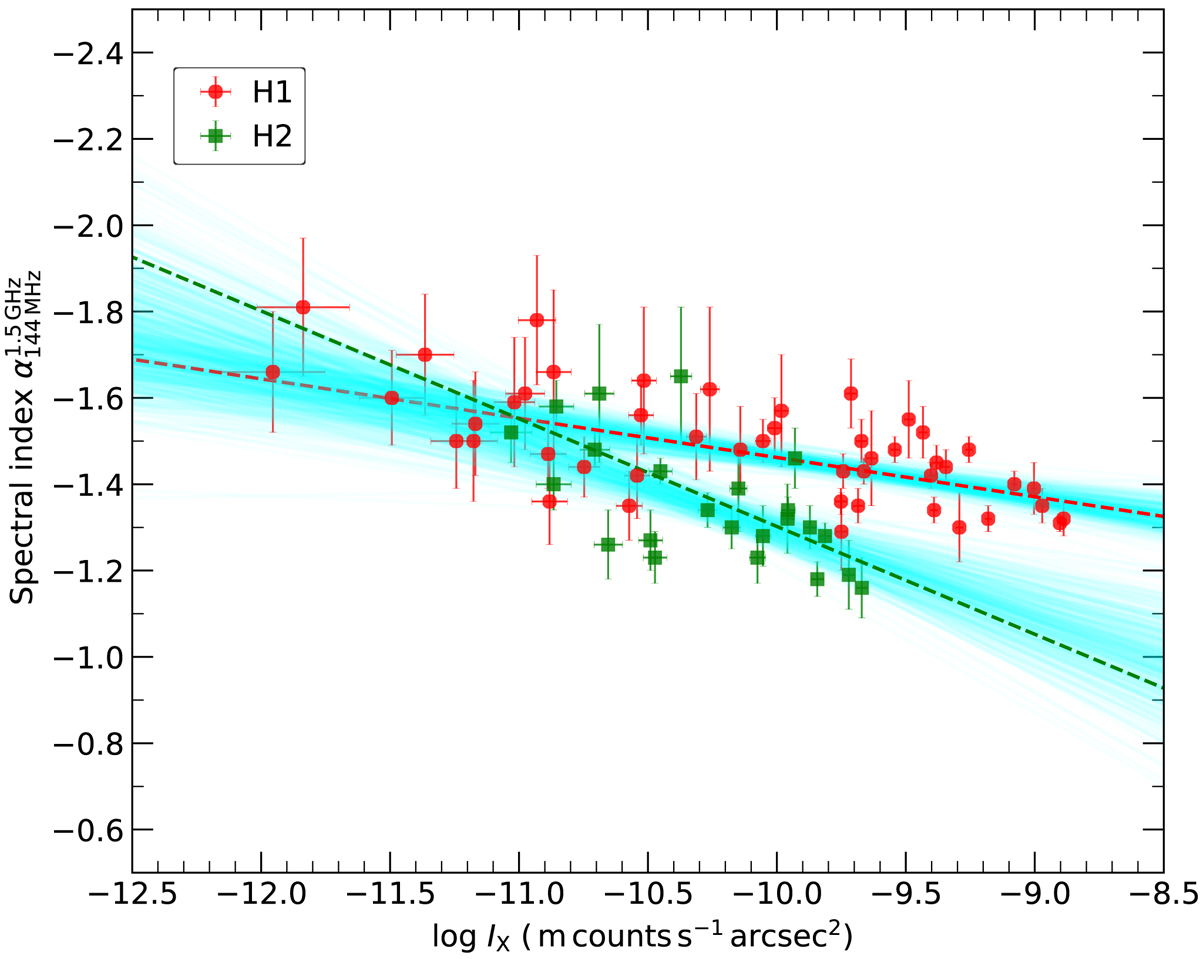
X-ray surface brightness versus spectral index of the radio halo emission. The Bayesian linear regression is performed for data points with at least a 3σ radio noise level. The red and green dashed lines correspond to the best-fit obtained separately for the H1 and H2 region of the halo. The anticorrelation between these two quantities is evident, indicating that the spectral index is flatter at high X-ray brightness and tends to get steeper in low X-ray brightness regions.
Current usage metrics show cumulative count of Article Views (full-text article views including HTML views, PDF and ePub downloads, according to the available data) and Abstracts Views on Vision4Press platform.
Data correspond to usage on the plateform after 2015. The current usage metrics is available 48-96 hours after online publication and is updated daily on week days.
Initial download of the metrics may take a while.