Fig. 11.
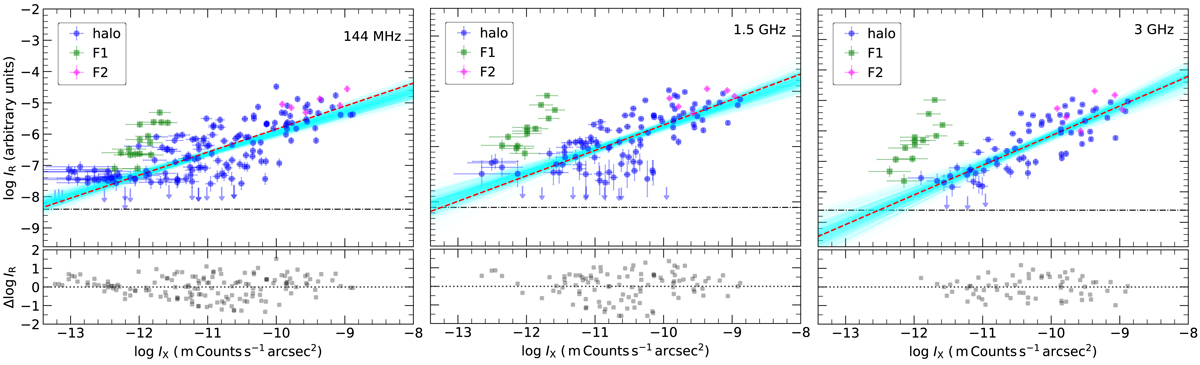
IR − IX relation of the halo in MACS J0717.5+3745, extracted in square boxes with of 8″ (about 50 kpc). Linmix best-fit relations are indicated by red dashed lines. The upper limits represent cells with data points below 2σ radio noise level. The horizontal black dash-dotted lines indicate the 1σ in the radio maps. The best-fit parameters are obtained for the halo emission (blue dots). The cyan lines show samples from the posterior distribution. Lower panel: residuals of log IR and log IX with respect to the Linmix best fit line. For the halo, the radio brightness correlates well with the X-ray at all three frequencies. The best-fitting slopes at 144 MHz, 1.5 GHz and 3 GHz are 0.67 ± 0.05, 0.81 ± 0.09, and 0.98 ± 0.09, respectively. The strong dependence of the slope on frequency suggests that the halo shows a spectral steepening toward high frequencies. Displayed errors in the radio flux density measurements include the statistical and systematic uncertainties.
Current usage metrics show cumulative count of Article Views (full-text article views including HTML views, PDF and ePub downloads, according to the available data) and Abstracts Views on Vision4Press platform.
Data correspond to usage on the plateform after 2015. The current usage metrics is available 48-96 hours after online publication and is updated daily on week days.
Initial download of the metrics may take a while.