Fig. 10.
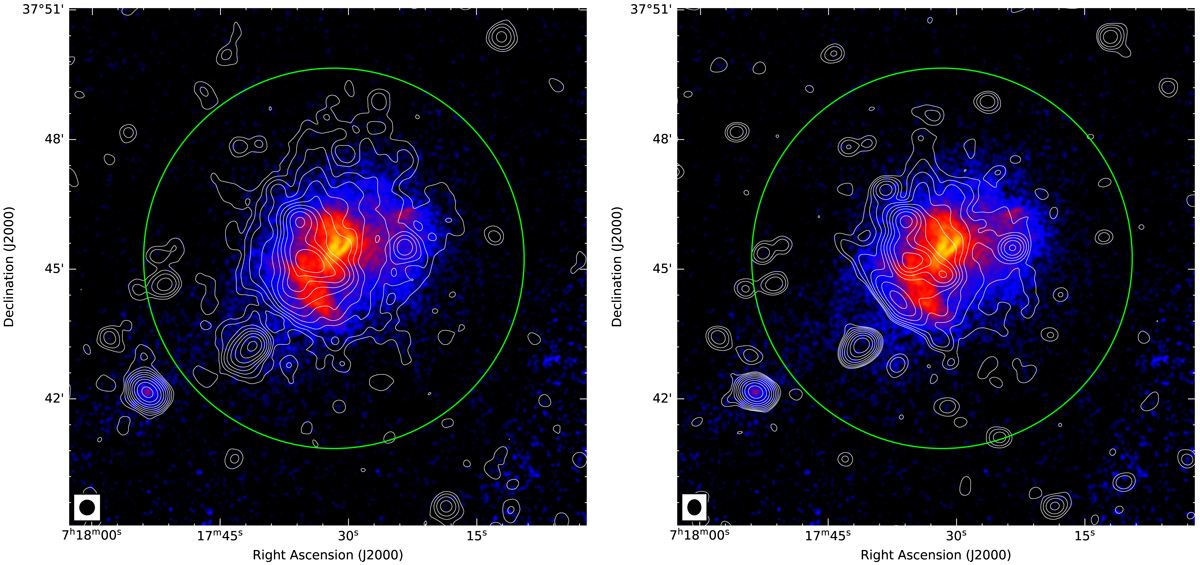
Low resolution (20″) LOFAR (left) and VLA L-band (right) radio contours, superimposed on the Chandra X-ray (0.5−2 keV) image, smoothed to a FWHM of 3″. Contour levels are drawn at [1, 2, 4, 8, …] × 4σrms, where σrms at 144 MHz and 1.5 GHz are 130 μ Jy beam−1 and 14 μJy beam−1 respectively. The radio halo shows a strikingly similar morphology to the ICM distribution (traced by the X-ray emission), confirming the connection between the hot gas and relativistic plasma. The emission from the radio halo at 144 MHz, further extends over the whole region of detected X-ray emission. The green circle shows R500 for the cluster.
Current usage metrics show cumulative count of Article Views (full-text article views including HTML views, PDF and ePub downloads, according to the available data) and Abstracts Views on Vision4Press platform.
Data correspond to usage on the plateform after 2015. The current usage metrics is available 48-96 hours after online publication and is updated daily on week days.
Initial download of the metrics may take a while.