Fig. 1
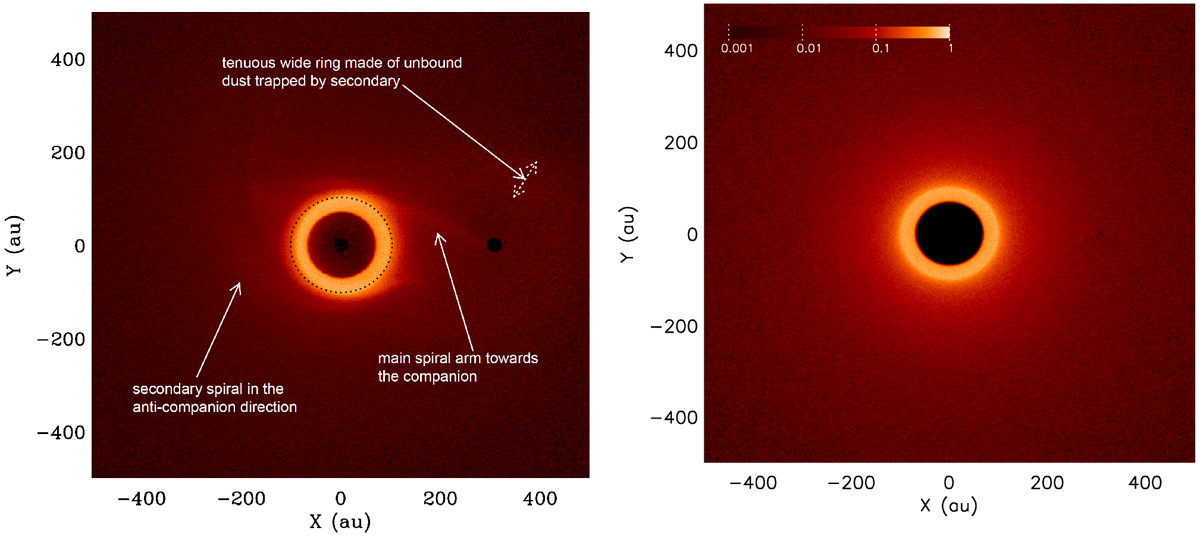
Nominal case (eb = 0, μ = 0.5 and ⟨τ⟩ = 2 × 10⁻³): normalised surface density map at steady state (left). The black dotted line represents the theoretical dynamical stability limit around the primary star as derived from Holman & Wiegert (1999). Because accurate orbital computing requires timesteps that are too short when grains pass too close to the primary or the secondary, we chose to remove all particles within 14 au of each star, hence the two black circles that mark the position of the two stars. Right panel: as a comparison, the corresponding map for a disc of same initial spatial extent without stellar companion. The relative colour scale is the same for both figures. An animated version of this figure, showing the disc’s evolution over one binary orbit is available online.
Current usage metrics show cumulative count of Article Views (full-text article views including HTML views, PDF and ePub downloads, according to the available data) and Abstracts Views on Vision4Press platform.
Data correspond to usage on the plateform after 2015. The current usage metrics is available 48-96 hours after online publication and is updated daily on week days.
Initial download of the metrics may take a while.