Fig. 5.
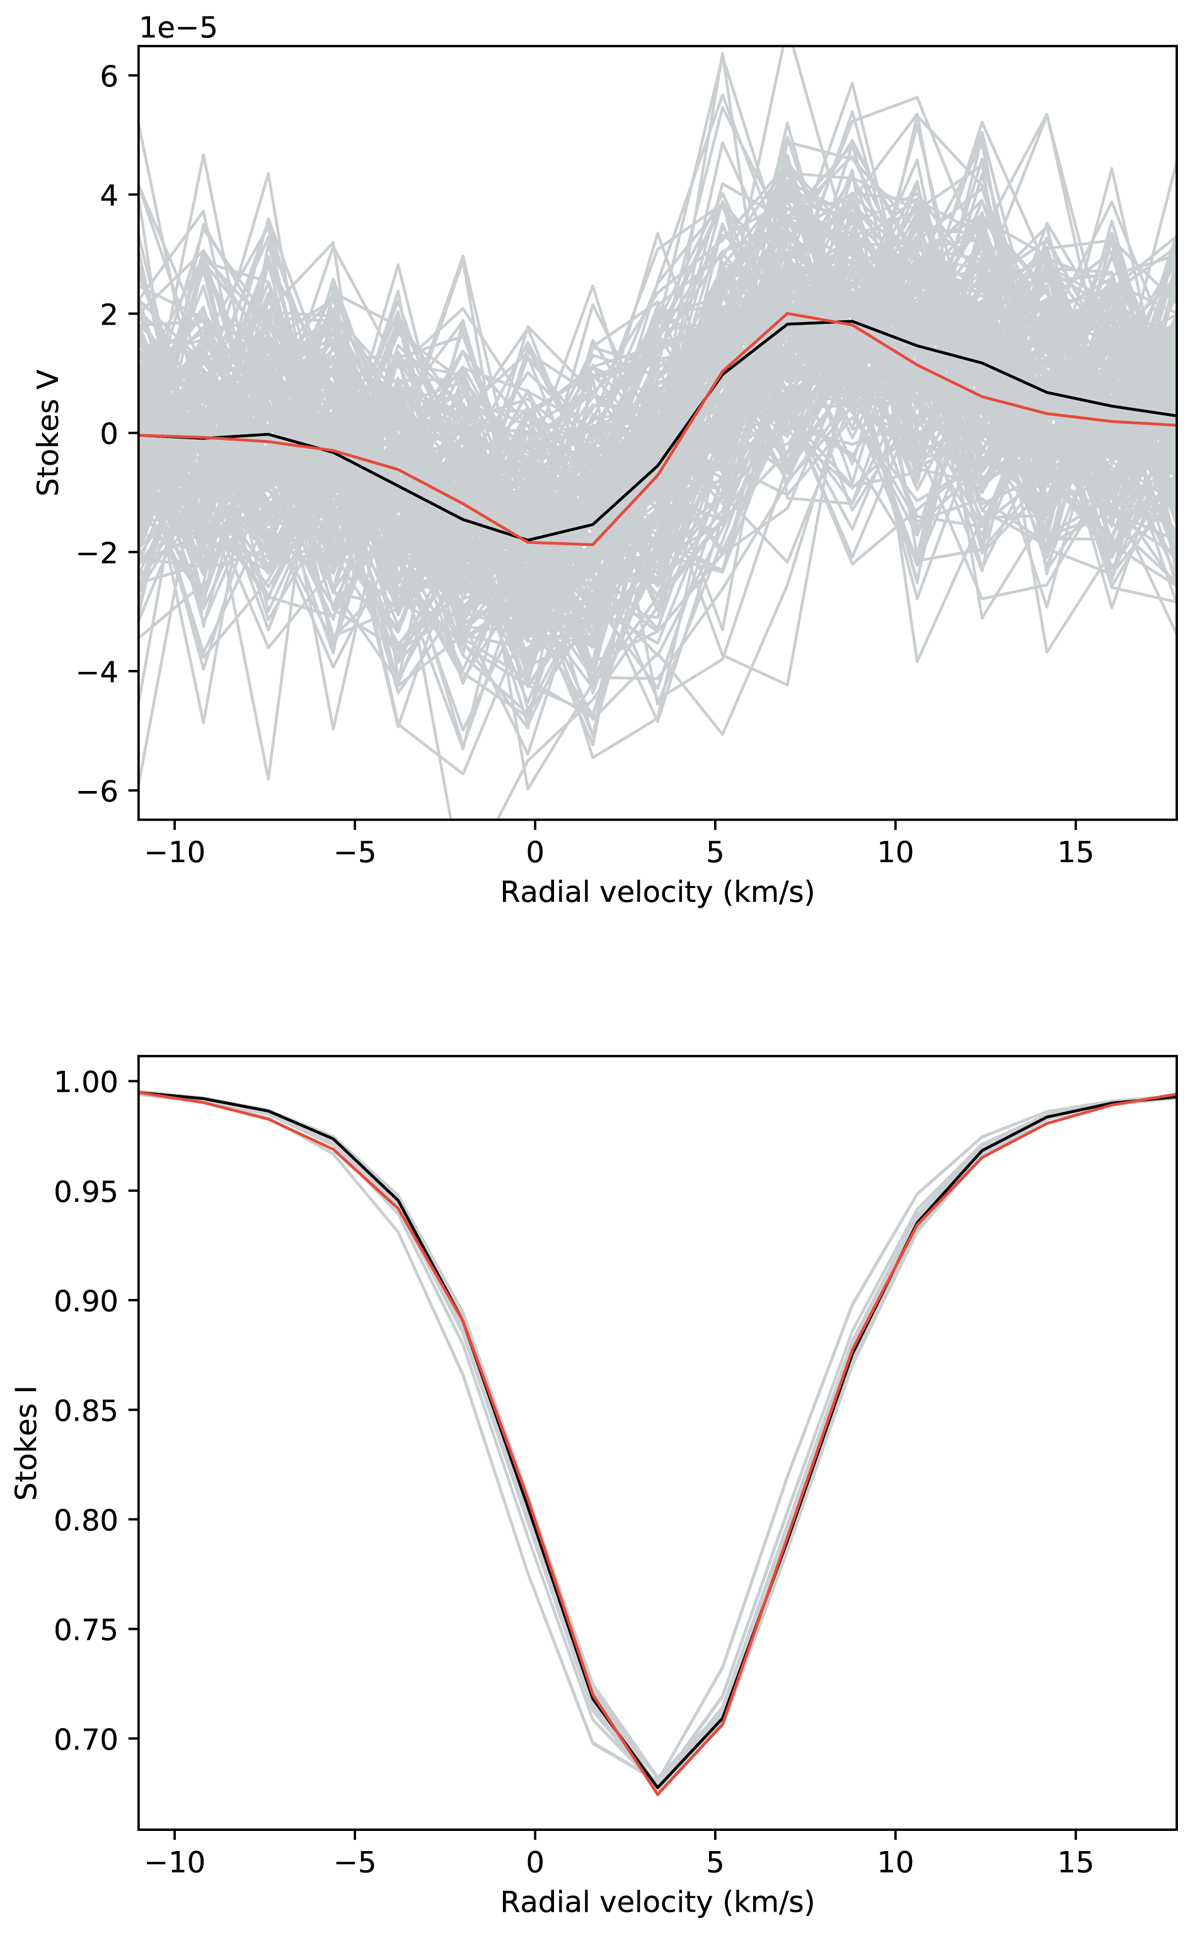
Comparison between the observed Stokes V (upper plot) and Stokes I (lower plot) LSD profiles and the synthetic averaged profiles of our magnetic model. The x-axis is the RV and the ordinates are (V/Ic) and (I/Ic), respectively. The observations are illustrated in gray (individual profiles) and in black (averaged profiles), while the synthetic profiles are shown in red.
Current usage metrics show cumulative count of Article Views (full-text article views including HTML views, PDF and ePub downloads, according to the available data) and Abstracts Views on Vision4Press platform.
Data correspond to usage on the plateform after 2015. The current usage metrics is available 48-96 hours after online publication and is updated daily on week days.
Initial download of the metrics may take a while.