Open Access
Fig. 2.
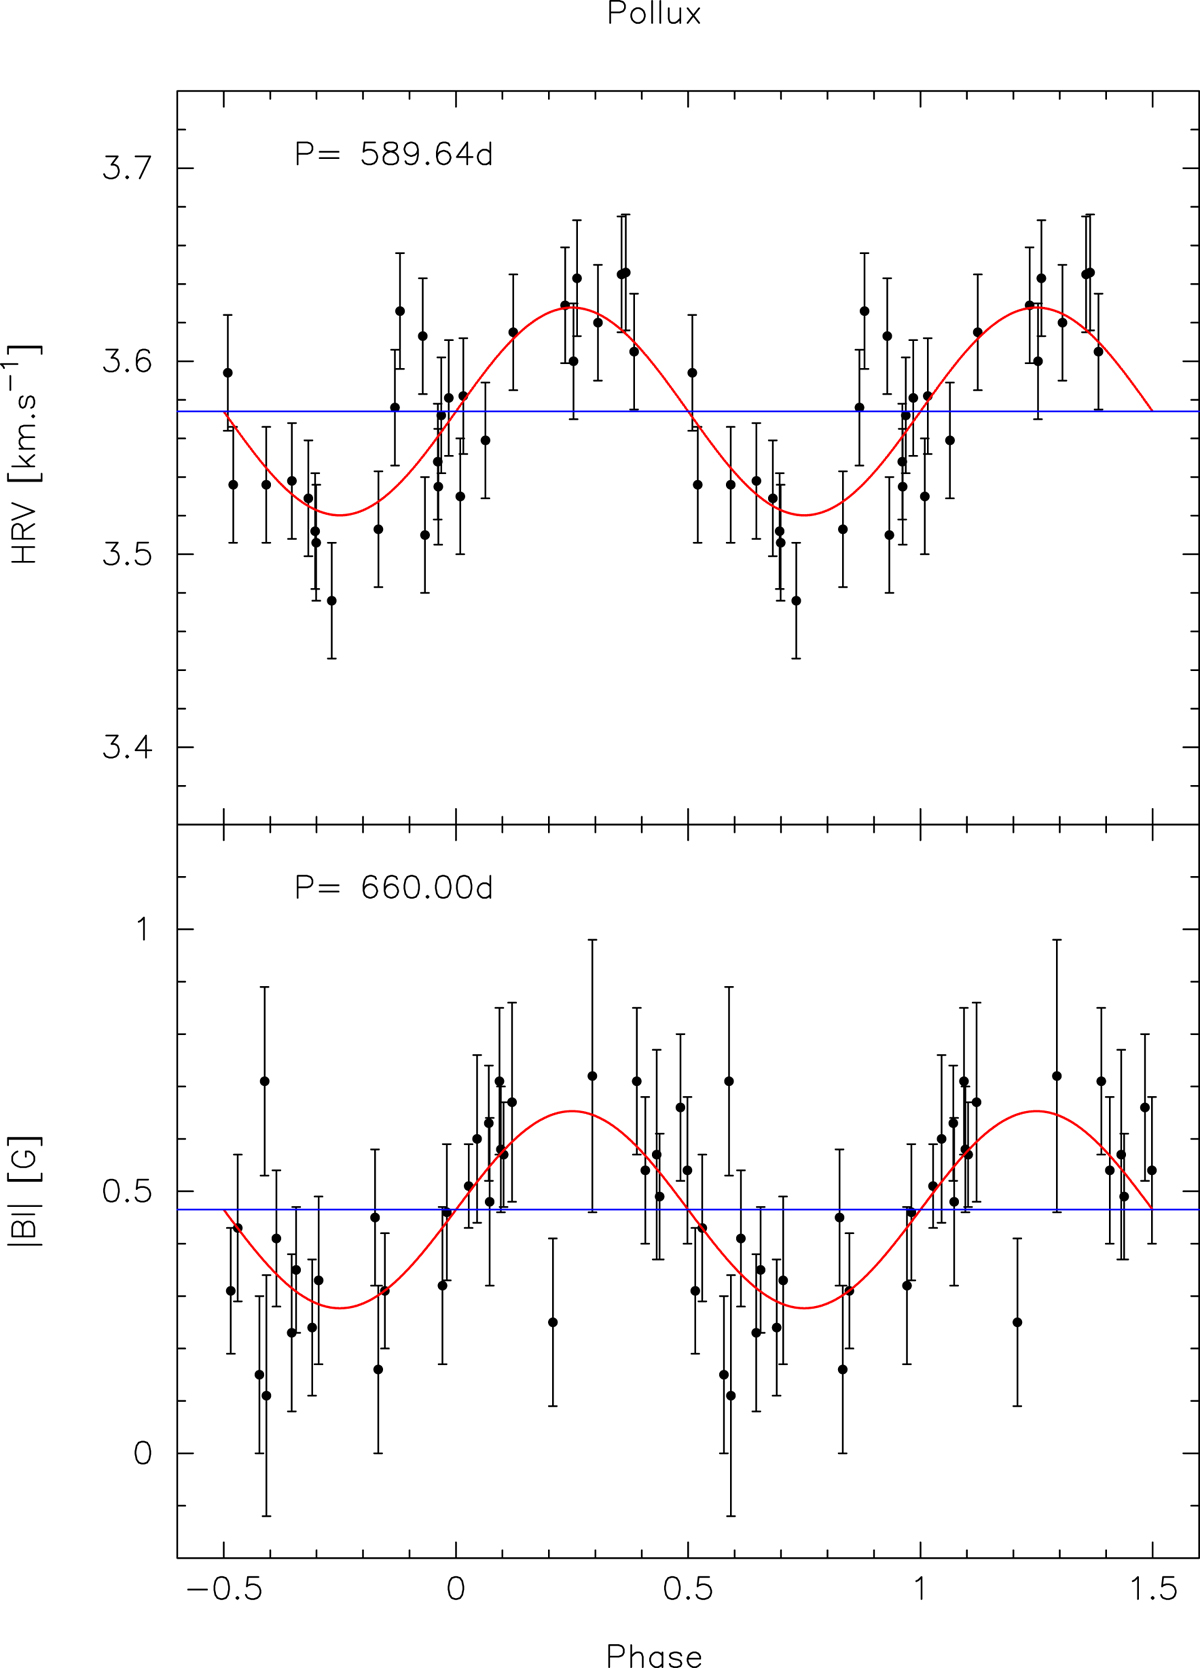
Radial velocity (upper plot) and unsigned Bℓ (lower plot) of Pollux phased with the 589.64 d and 660 d periods, respectively. The mean value of RV and |Bℓ| are shown. Two periods are plotted for clarity.
Current usage metrics show cumulative count of Article Views (full-text article views including HTML views, PDF and ePub downloads, according to the available data) and Abstracts Views on Vision4Press platform.
Data correspond to usage on the plateform after 2015. The current usage metrics is available 48-96 hours after online publication and is updated daily on week days.
Initial download of the metrics may take a while.