Fig. 3.
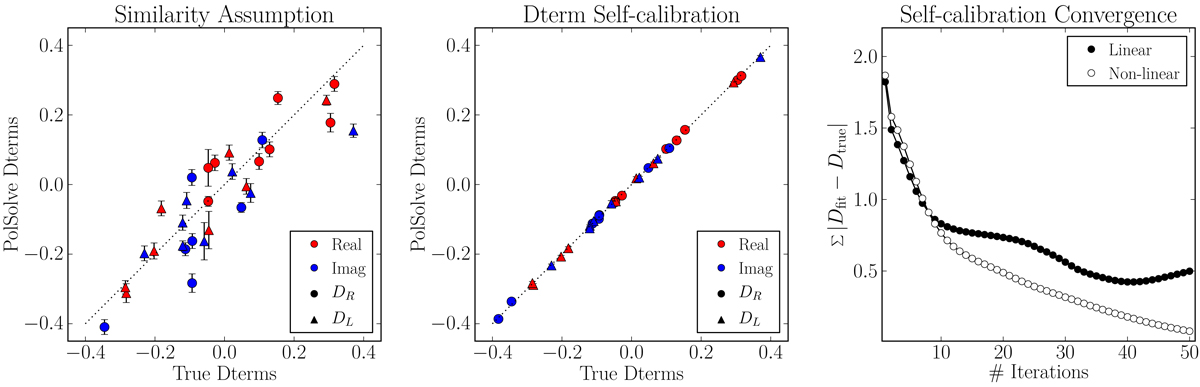
Results of polsolve applied to our simulated EHT observations. Left: correlation between the true antenna D-terms and the values fitted using the LPCAL similarity assumption (see text). Center: correlation for the D-terms fitted after fifty iterations of polarimetry self-calibration. Right: L1 norm between true and fitted D-terms, as a function of the number of self-calibration iterations, for the case of linear D-term approximation (black points) and full nonlinear D-term model (white points).
Current usage metrics show cumulative count of Article Views (full-text article views including HTML views, PDF and ePub downloads, according to the available data) and Abstracts Views on Vision4Press platform.
Data correspond to usage on the plateform after 2015. The current usage metrics is available 48-96 hours after online publication and is updated daily on week days.
Initial download of the metrics may take a while.