Fig. 2.
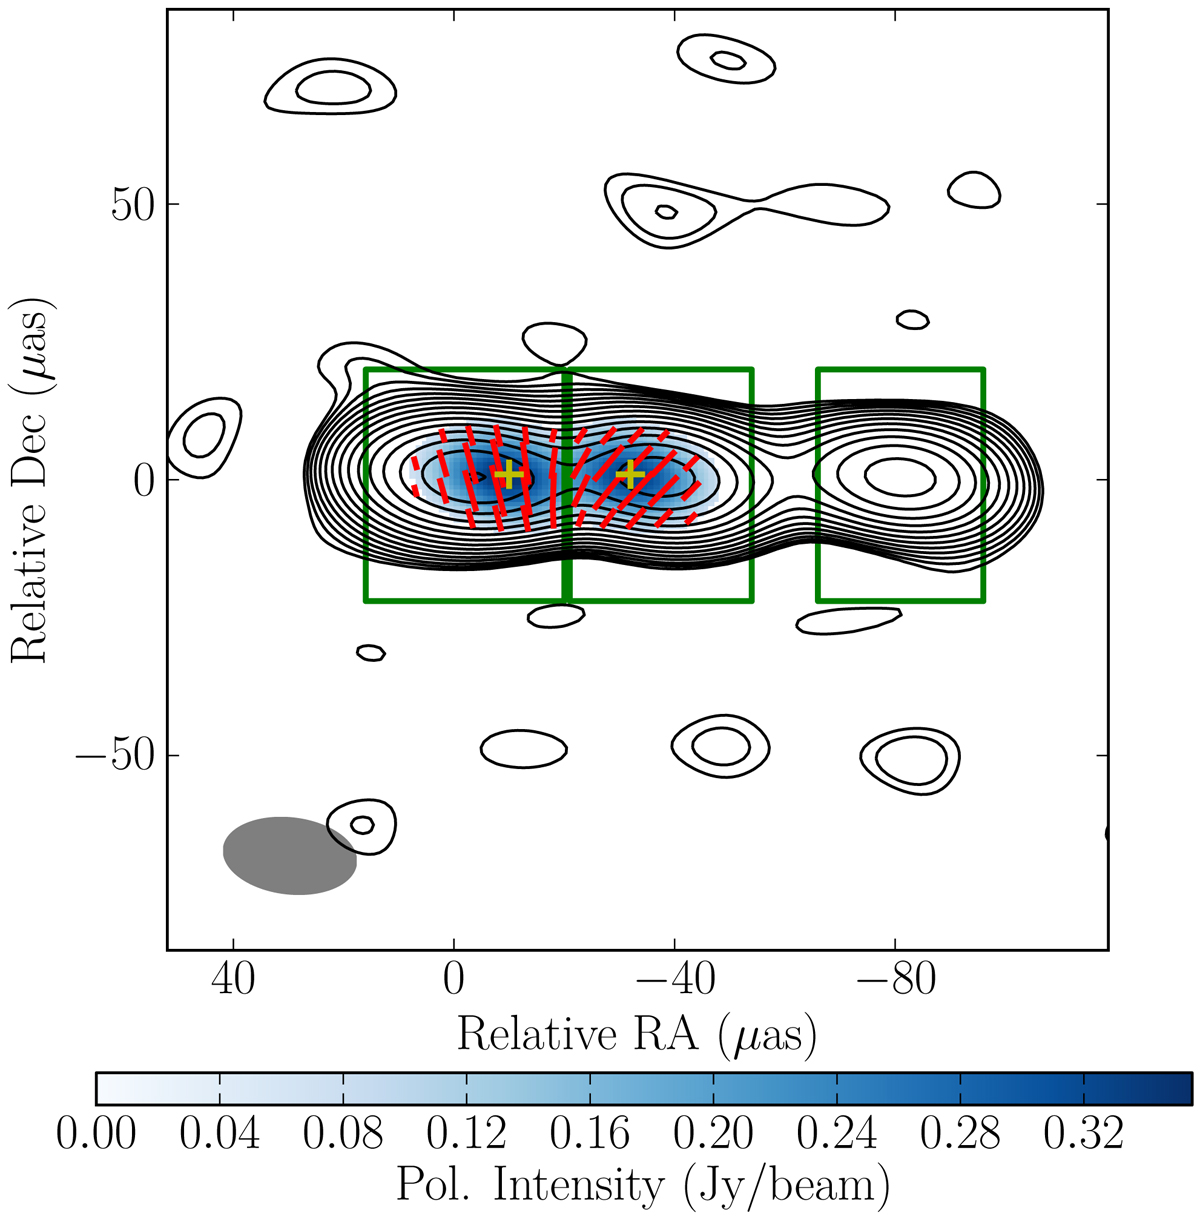
CLEAN image of the synthetic EHT observations free from instrumental polarization. The full width at half maximum (FWHM) of the restoring beam is shown at bottom left. The 16 contour levels are separated in logarithmic scale and represent total intensity (peak of 1.28 Jy beam−1; lowest contour of 1.3 mJy beam−1); the blue color scale represents polarized intensity (peak of 0.36 Jy beam−1) and the red lines represent the EVPA spatial distribution. The yellow crosses indicate the locations of the polarization intensity peaks, which are shifted with respect to those of Stokes ℐ. The green boxes indicate the extent of the polarization subcomponents used in the D-term fitting with the LPCAL approach.
Current usage metrics show cumulative count of Article Views (full-text article views including HTML views, PDF and ePub downloads, according to the available data) and Abstracts Views on Vision4Press platform.
Data correspond to usage on the plateform after 2015. The current usage metrics is available 48-96 hours after online publication and is updated daily on week days.
Initial download of the metrics may take a while.