Fig. 1.
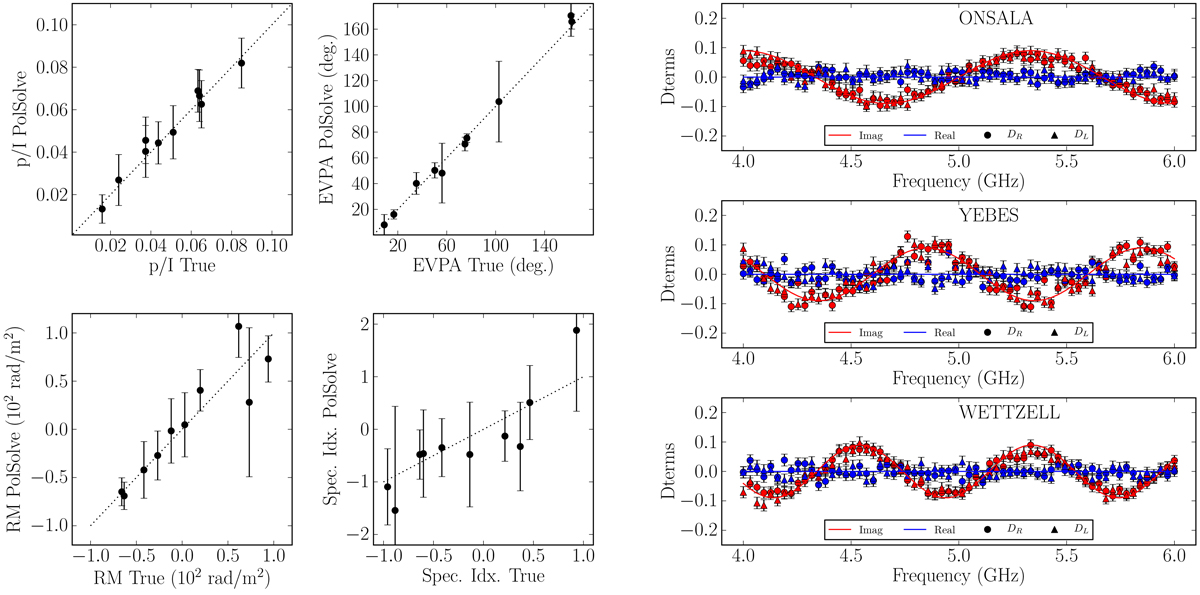
Results of the polsolve fit to the simulated VGOS observations. Left panels: correlation plots between the true source polarization quantities (fractional polarization and EVPA at the fiducial frequency, RM, and polarization spectral index) and the polsolve estimates. The dotted lines indicate the 1:1 correlation. Right panels: simulated D-term spectra as thick lines, resulting from a frequency-dependent phase offset between the linear polarizers of the antennas, and the values fitted by polsolve.
Current usage metrics show cumulative count of Article Views (full-text article views including HTML views, PDF and ePub downloads, according to the available data) and Abstracts Views on Vision4Press platform.
Data correspond to usage on the plateform after 2015. The current usage metrics is available 48-96 hours after online publication and is updated daily on week days.
Initial download of the metrics may take a while.