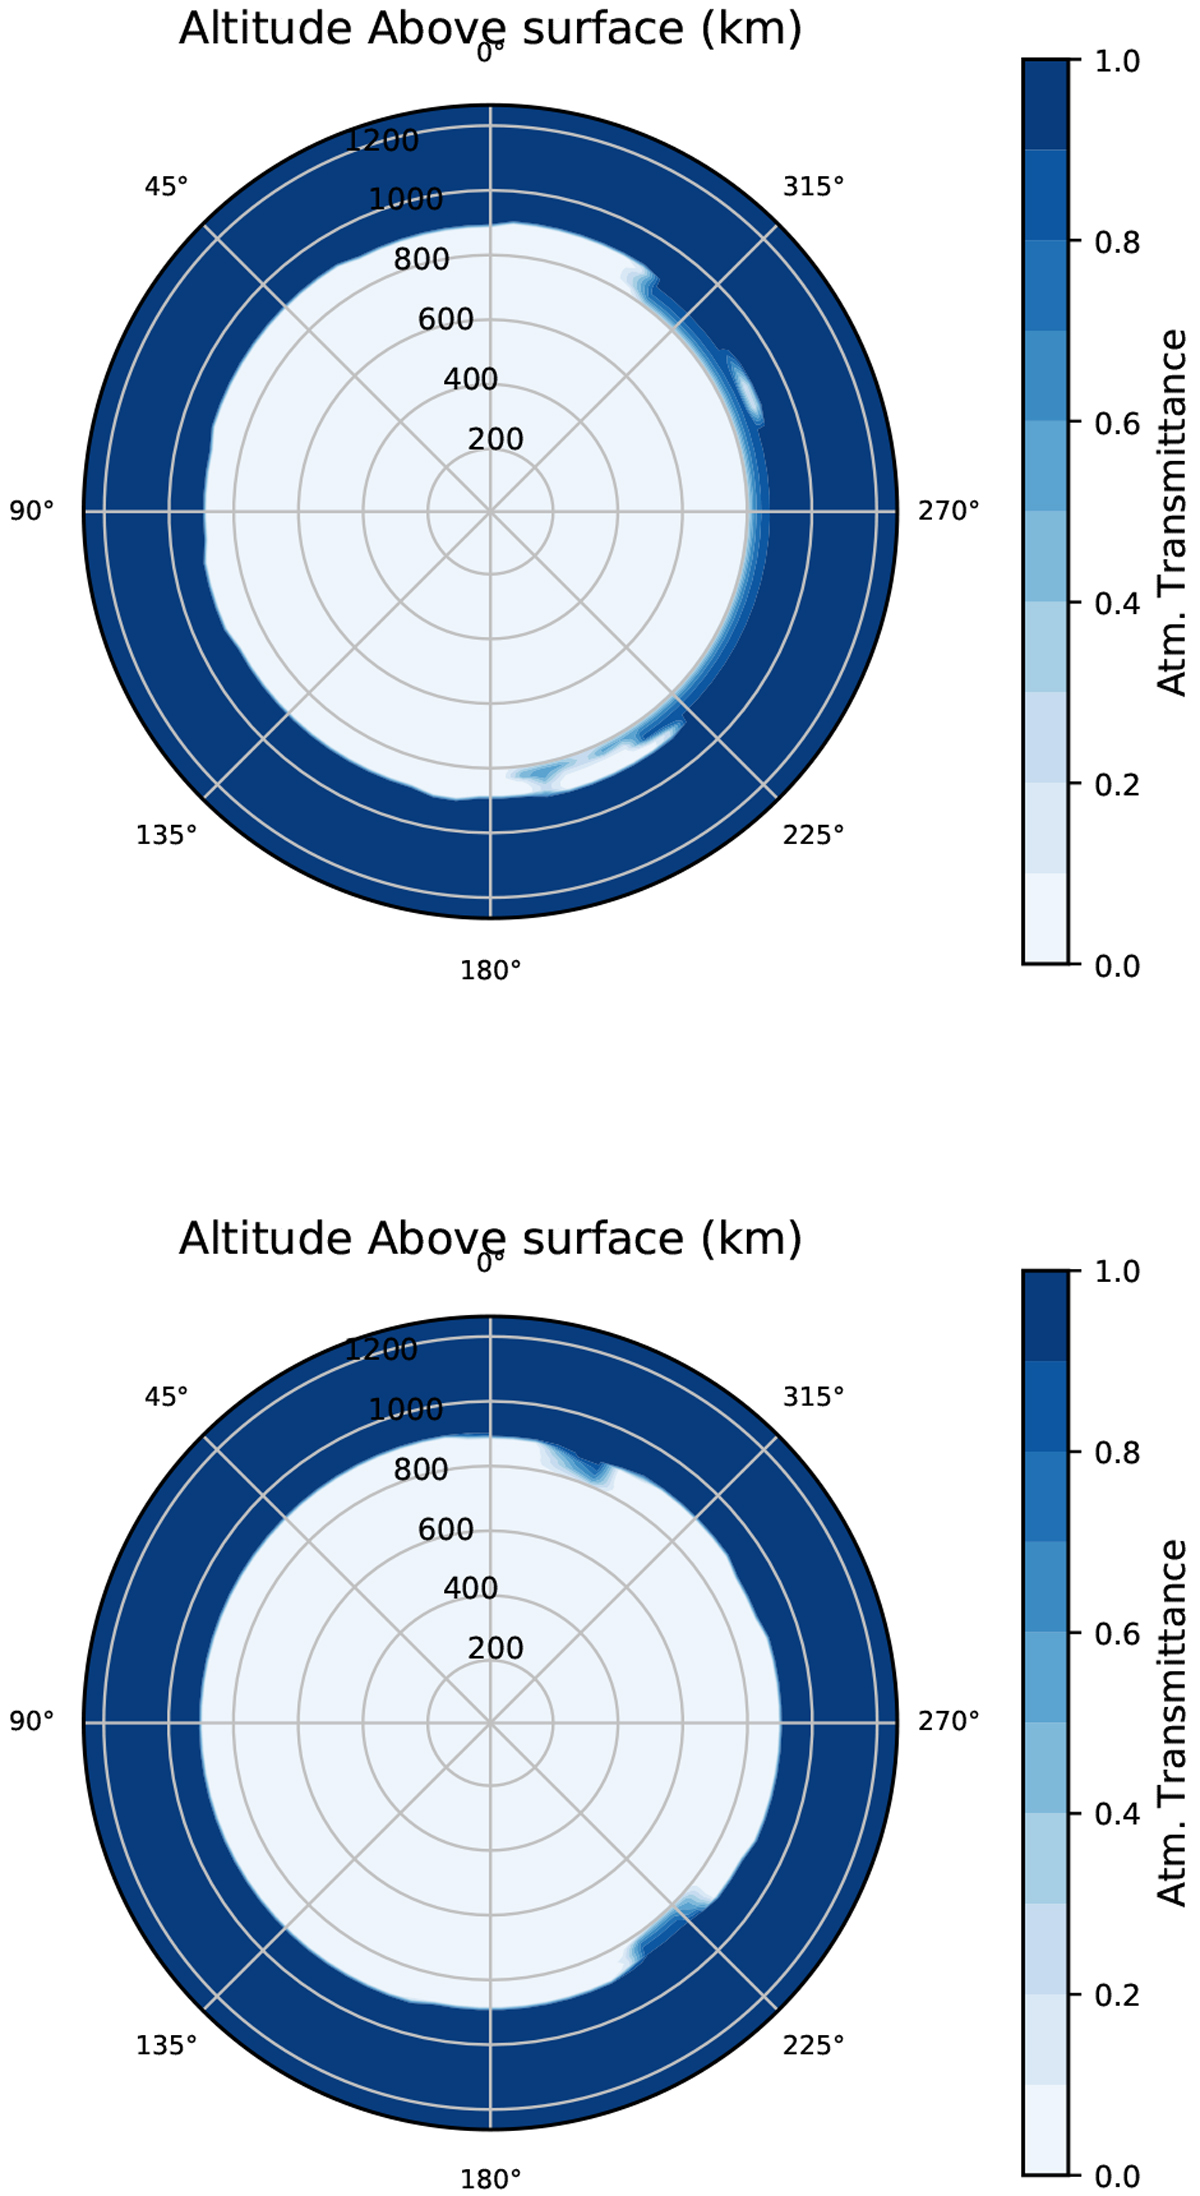
Fig. 9

Maps of transmittance of the atmosphere at two different times for the 300× solar metallicity case with 106nuclei kg−1 computed with Pytmosph3R (Caldas et al. 2019). The colour shading shows the transmittance that goes from zero where the atmosphere is opaque to one where it completely transmits the light. The surface is defined here as the first model level (80 bar). These maps are computed at 0.4 μm where the contribution of water clouds is particularly visible. The atmosphere is seen from the night side so that the north pole corresponds to 0° and the equatorial east limb (longitude of +90°) corresponds to 90° in the plots.
Current usage metrics show cumulative count of Article Views (full-text article views including HTML views, PDF and ePub downloads, according to the available data) and Abstracts Views on Vision4Press platform.
Data correspond to usage on the plateform after 2015. The current usage metrics is available 48-96 hours after online publication and is updated daily on week days.
Initial download of the metrics may take a while.


