Fig. 2.
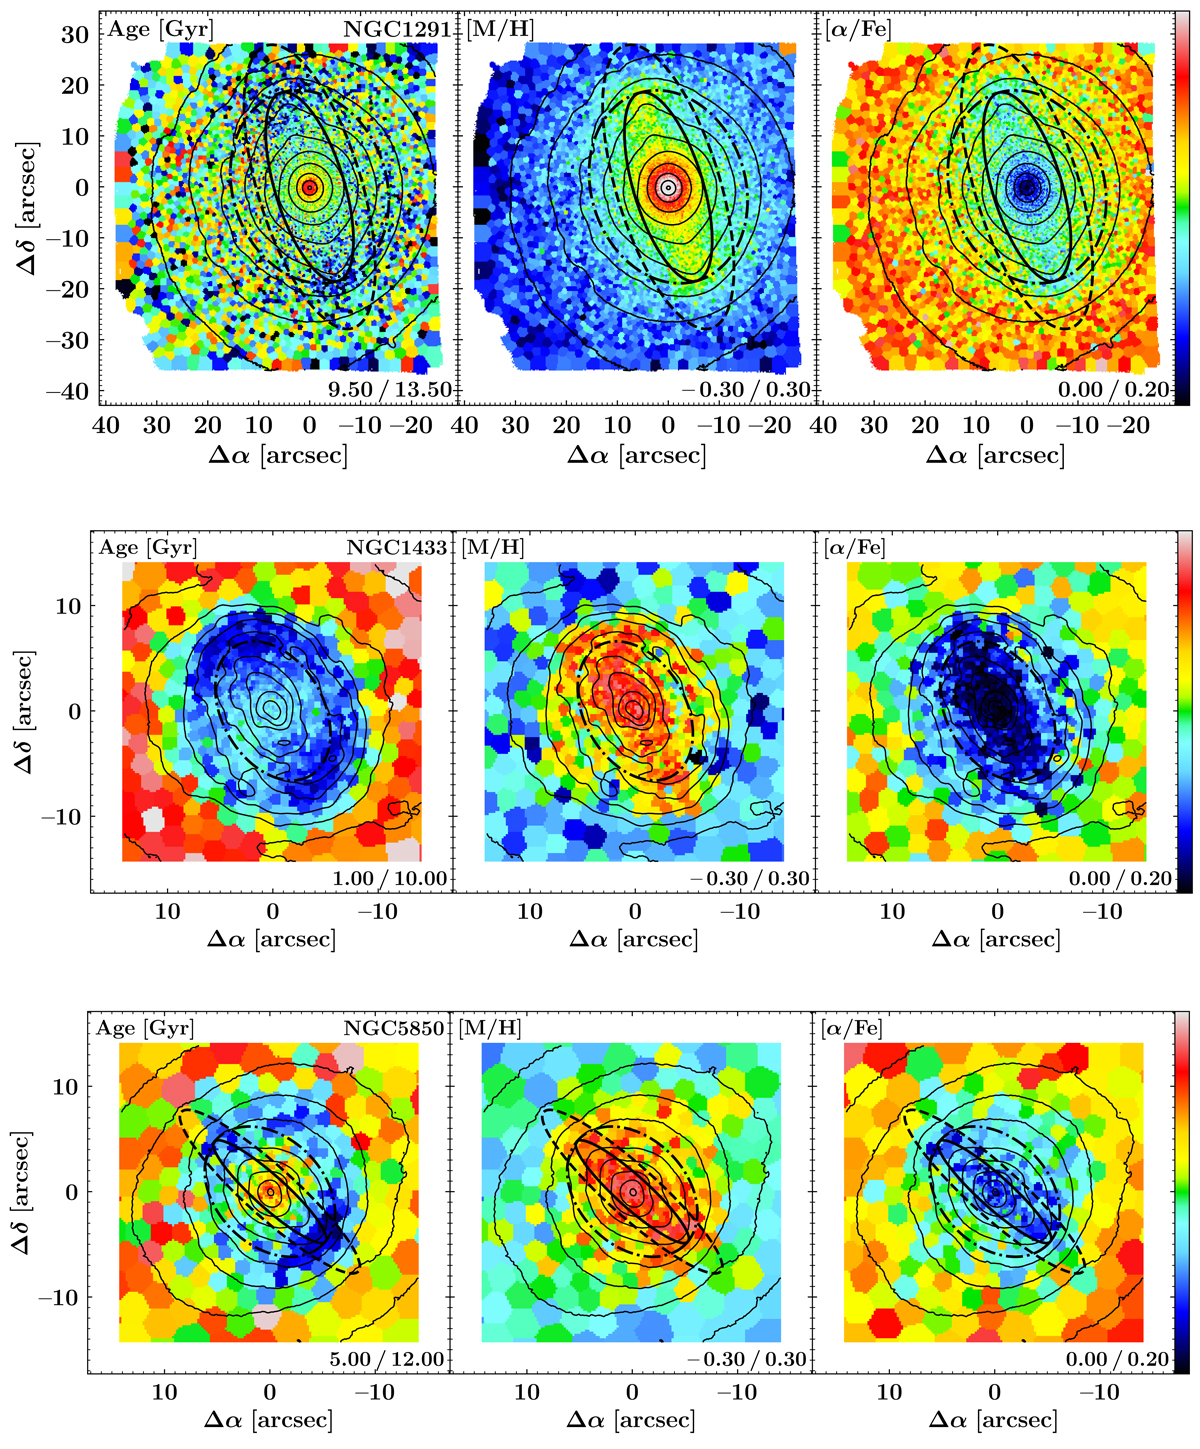
Maps of light-weighted, mean stellar population properties of NGC 1291 (upper panels), NGC 1433 (central panels), and NGC 5850 (lower panels), focussed on the spatial region of the inner bar (see Bittner et al. 2020, for maps showing the entire MUSE field of view). Each set of panels displays age, [M/H], and [α/Fe] enhancements and the limits of the respective colour bar are stated in the lower-right corner of each panel. The dash-dotted ellipses display the approximate extent of the inner bars according to the visual measurements of Herrera-Endoqui et al. (2015), while dashed ellipses show the results from the multi-component decompositions of de Lorenzo-Cáceres et al. (2019). Solid ellipses combine the inner bar lengths from Herrera-Endoqui et al. (2015) with the ellipticities of de Lorenzo-Cáceres et al. (2019) and trace the appearance of the inner bars excellently. NGC 1433 is not included in the photometric decompositions of de Lorenzo-Cáceres et al. (2019), hence only a dash-dotted ellipse is displayed. Based on the reconstructed intensities from the MUSE cube, we display isophotes in steps of 0.5 mag. North is up; east is to the left.
Current usage metrics show cumulative count of Article Views (full-text article views including HTML views, PDF and ePub downloads, according to the available data) and Abstracts Views on Vision4Press platform.
Data correspond to usage on the plateform after 2015. The current usage metrics is available 48-96 hours after online publication and is updated daily on week days.
Initial download of the metrics may take a while.