Fig. 9.
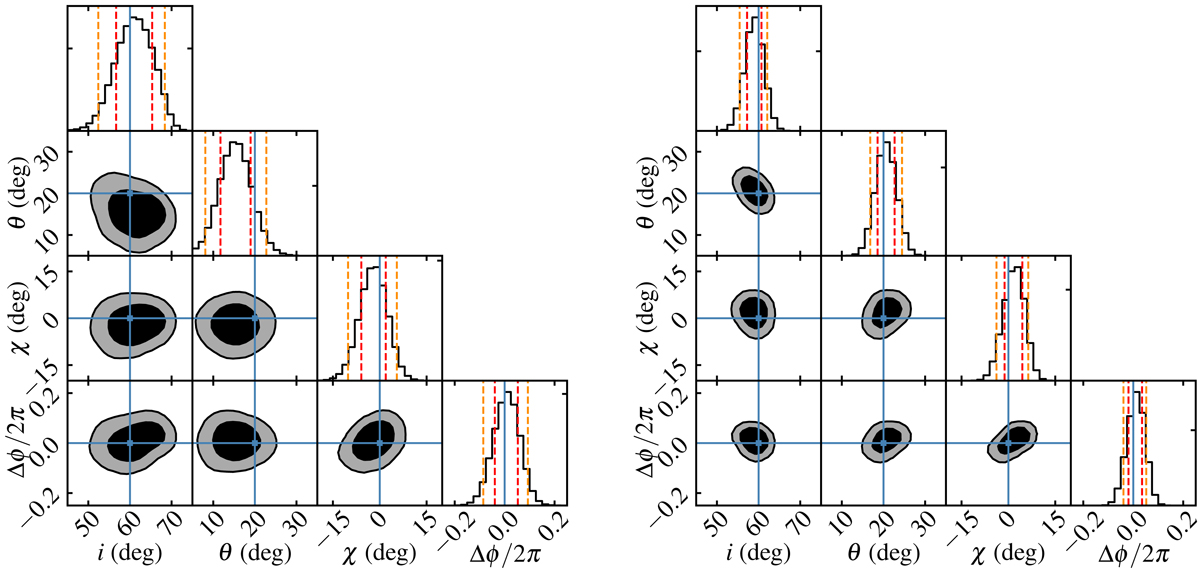
Posterior probability distributions for NS parameters when combining fits from three realisations of synthetic data produced assuming a 200 ks (left panels) and a 1 Ms (right panels) exposure time and the fiducial model shown in Table 1. In the two-dimensional posterior distributions, the black colour shows a 68% and the grey colour shows a 95% highest posterior density credible region. In the one-dimensional posterior distributions, the red dashed lines show a 68% and the dark orange dashed lines show a 95% highest posterior density credible interval. The blue lines show the input values.
Current usage metrics show cumulative count of Article Views (full-text article views including HTML views, PDF and ePub downloads, according to the available data) and Abstracts Views on Vision4Press platform.
Data correspond to usage on the plateform after 2015. The current usage metrics is available 48-96 hours after online publication and is updated daily on week days.
Initial download of the metrics may take a while.