Fig. 7.
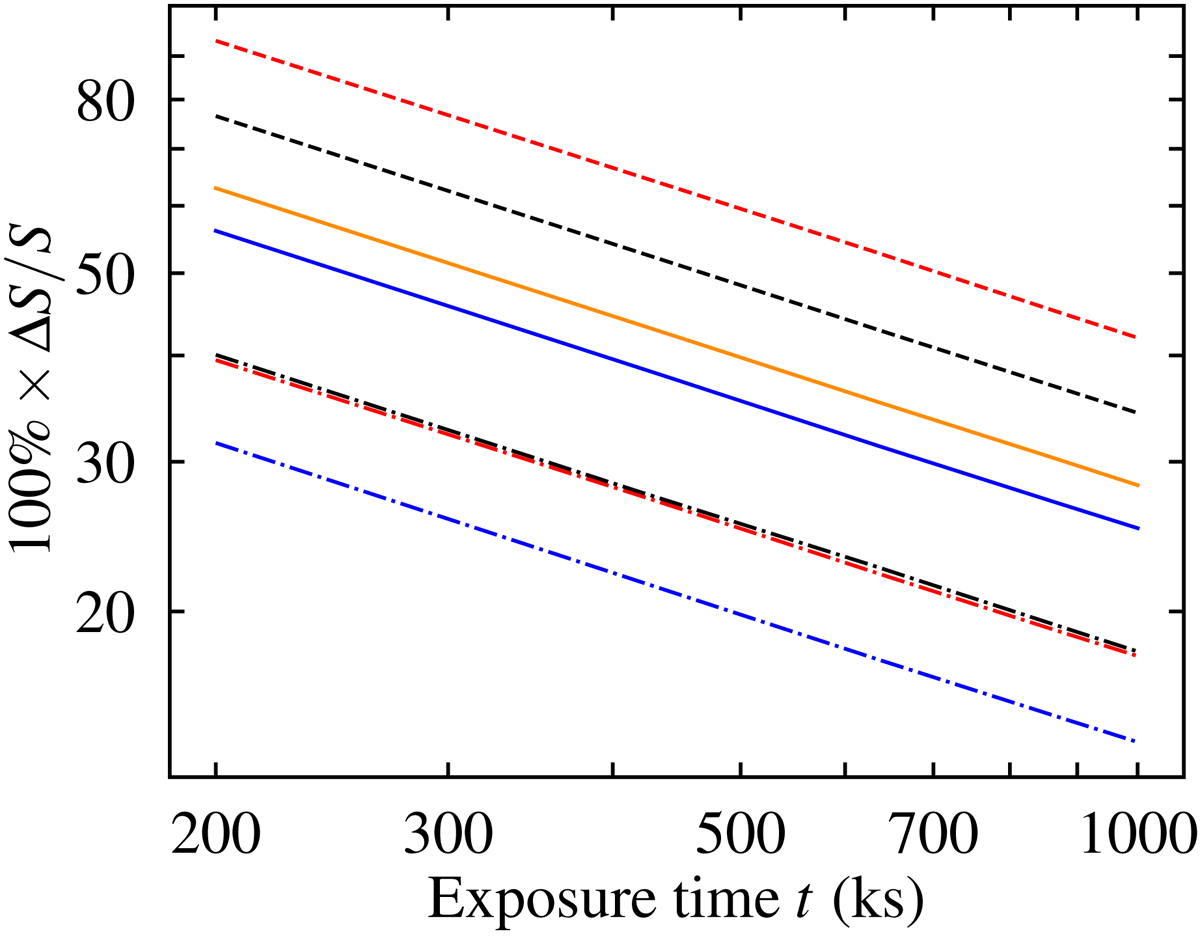
Average relative minimum errors in the measured energy-integrated Stokes q and u as a function of observation time for the one-spot models (calculated as ΔS/S = ([Δq/qm]min + [Δu/um]min)/2. The solid blue curve shows the errors with the fiducial parameters (shown in Table 1). The blue dash-dotted curve corresponds to similar data but with pmax = 0.1171, the black dashed curve with i = 50°, the black dash-dotted curve with i = 70°, the red dashed curve with θ = 10°, the red dash-dotted curve with θ = 30°, and the orange solid curve with ρ = 30° (also explained in Table 2). Curves were interpolated from the calculated points as in Fig. 6.
Current usage metrics show cumulative count of Article Views (full-text article views including HTML views, PDF and ePub downloads, according to the available data) and Abstracts Views on Vision4Press platform.
Data correspond to usage on the plateform after 2015. The current usage metrics is available 48-96 hours after online publication and is updated daily on week days.
Initial download of the metrics may take a while.