Free Access
Fig. 6.
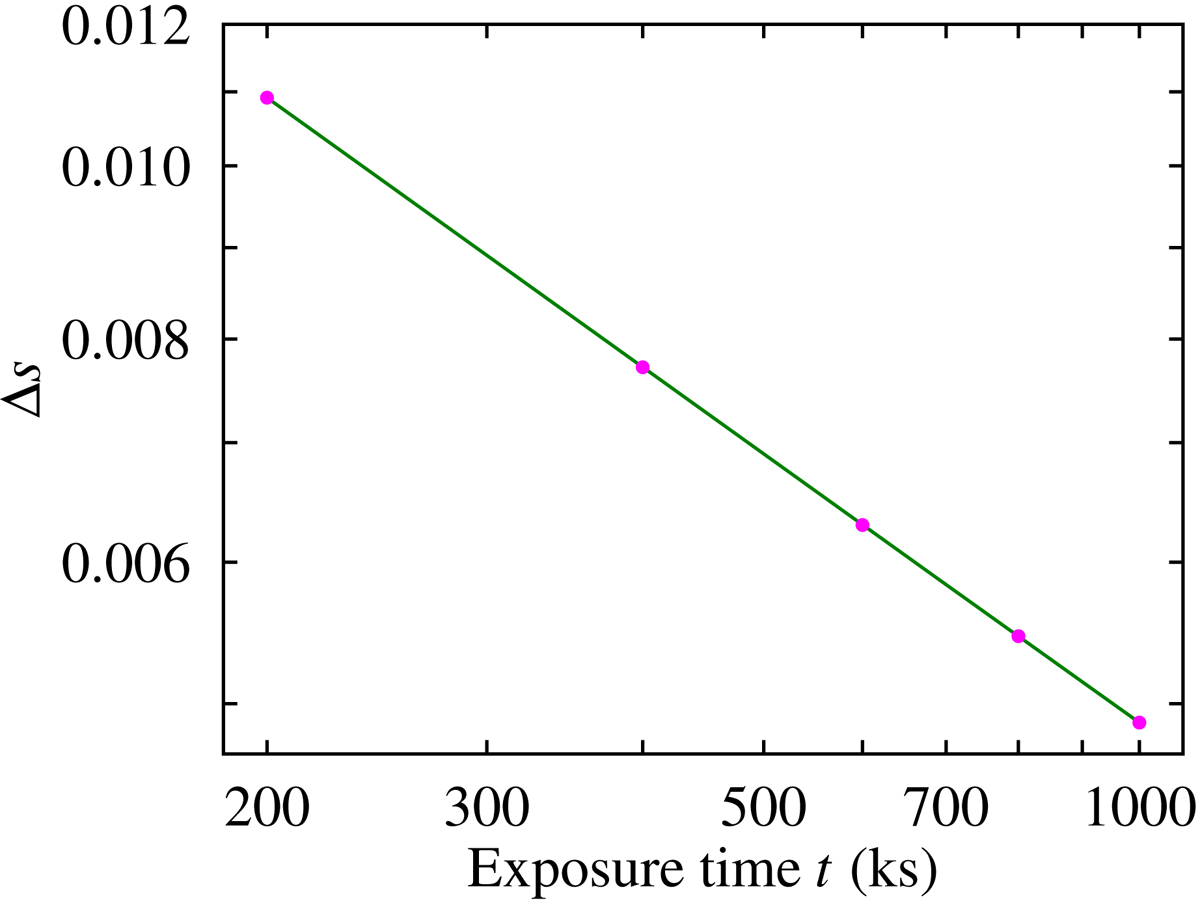
Average absolute minimum errors in the measured energy-integrated Stokes q and u as a function of observation time (for the one-spot models specified in Table 2). The curves were calculated for 200, 400, 600, 800, and 1000 ks (shown as purple dots) and interpolated linearly in a logarithmic scale for other values.
Current usage metrics show cumulative count of Article Views (full-text article views including HTML views, PDF and ePub downloads, according to the available data) and Abstracts Views on Vision4Press platform.
Data correspond to usage on the plateform after 2015. The current usage metrics is available 48-96 hours after online publication and is updated daily on week days.
Initial download of the metrics may take a while.