Fig. 5.
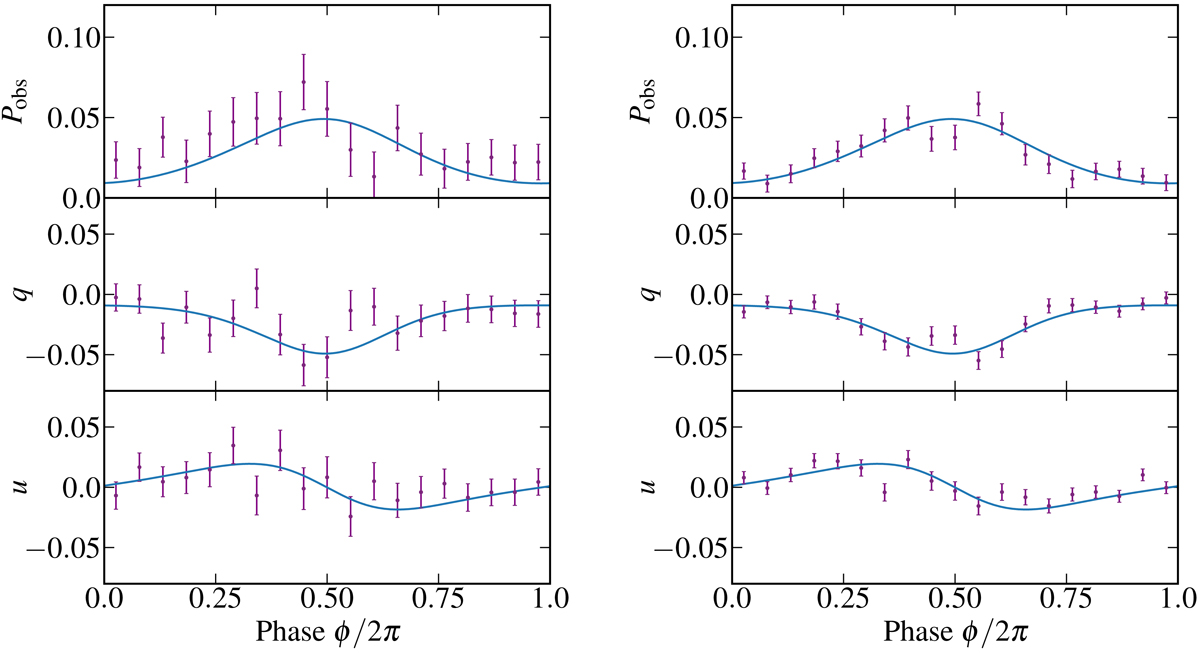
Simulated PD and normalized Stokes q and u profiles for 200 ks (left panels) and 1 Ms (right panels) exposure times and the fiducial one-spot model when computing a weighted average over energy range 2–8 keV. The blue curve shows the theoretical model and the purple dots show the simulated observed data including the measurement errors.
Current usage metrics show cumulative count of Article Views (full-text article views including HTML views, PDF and ePub downloads, according to the available data) and Abstracts Views on Vision4Press platform.
Data correspond to usage on the plateform after 2015. The current usage metrics is available 48-96 hours after online publication and is updated daily on week days.
Initial download of the metrics may take a while.