Fig. 2.
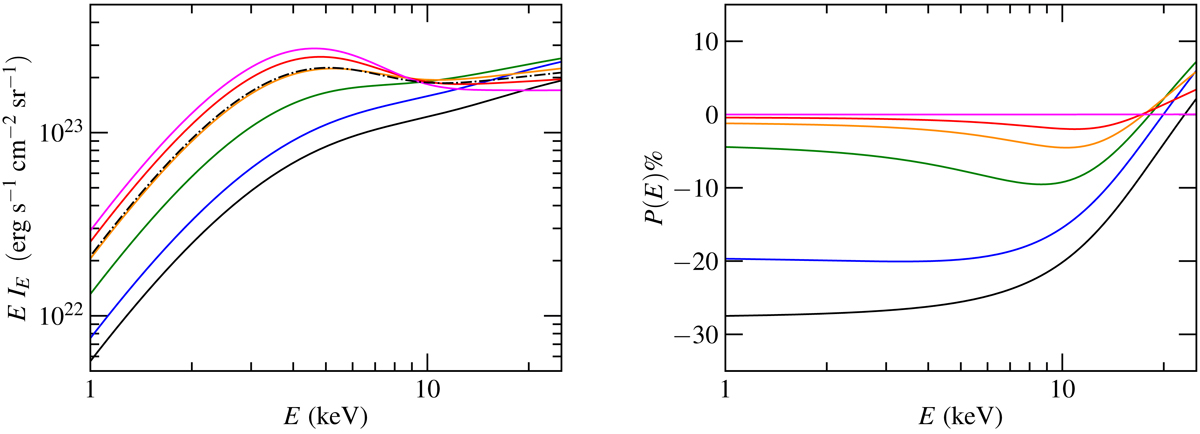
Energy dependence of emitted intensity (left panel) and PD (right panel). Black, blue, green, orange, red, and magenta solid lines show the model for μ= 0.0, 0.2, 0.4, 0.6, 0.8, and 1.0, respectively. The dot-dashed black curve (left) shows the intensity corresponding to the angle-independent result of model SIMPL, namely (1 − Xsc)BE(Tbb)+XscIc(E) (see Sect. 2.1.1). The model was calculated with the parameters shown in Table 1.
Current usage metrics show cumulative count of Article Views (full-text article views including HTML views, PDF and ePub downloads, according to the available data) and Abstracts Views on Vision4Press platform.
Data correspond to usage on the plateform after 2015. The current usage metrics is available 48-96 hours after online publication and is updated daily on week days.
Initial download of the metrics may take a while.