Fig. 10.
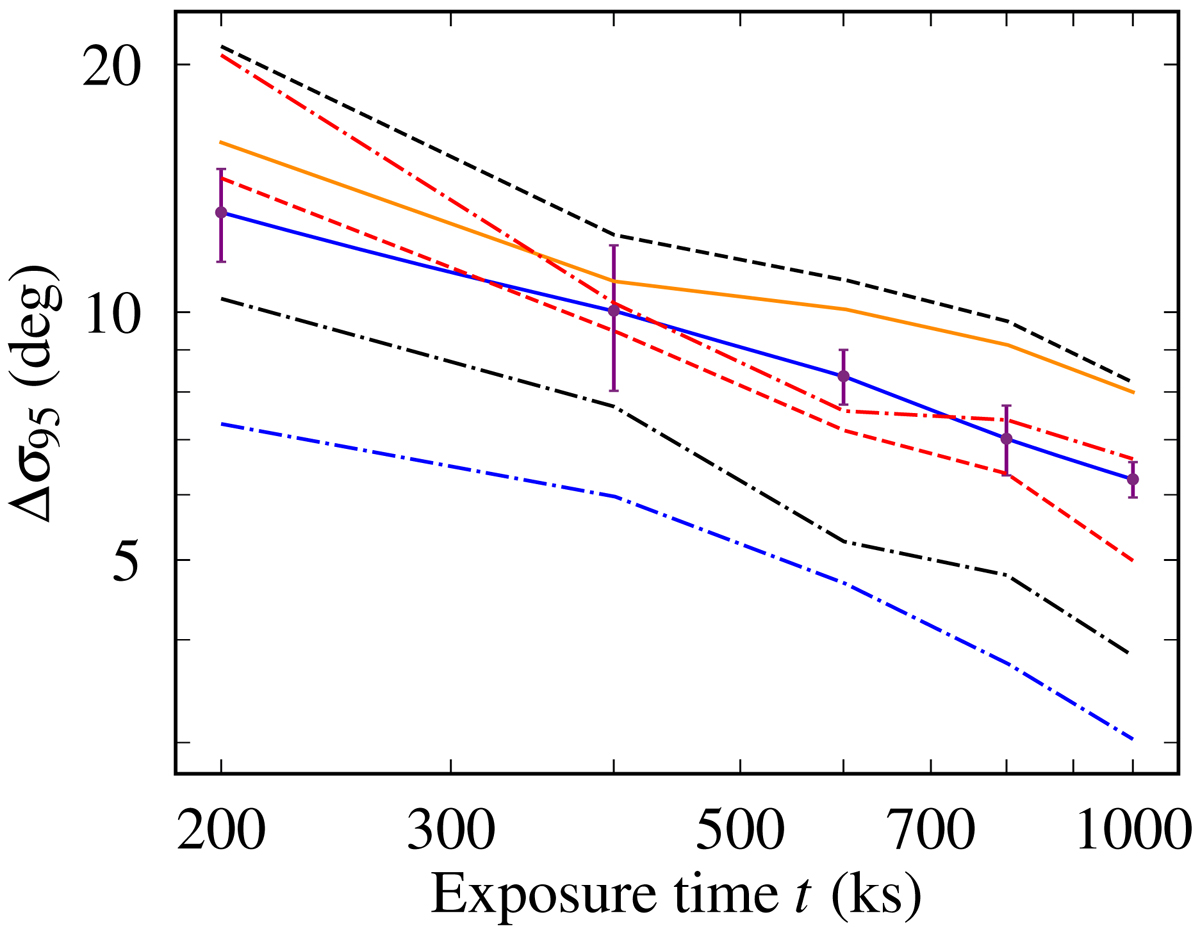
Average width of the 95% credible interval for the measured i and θ as a function of the observing time. The curves, colours, and interpolation method correspond to those in Fig. 7, but the solid blue curve corresponds to the average constraints from the three different synthetic data generations (using the same model parameters). Purple error bars show the maximum deviation between the average and single data generation results. The other lines show constraints for only one realisation of the synthetic data (for each exposure time).
Current usage metrics show cumulative count of Article Views (full-text article views including HTML views, PDF and ePub downloads, according to the available data) and Abstracts Views on Vision4Press platform.
Data correspond to usage on the plateform after 2015. The current usage metrics is available 48-96 hours after online publication and is updated daily on week days.
Initial download of the metrics may take a while.