Fig. 1.
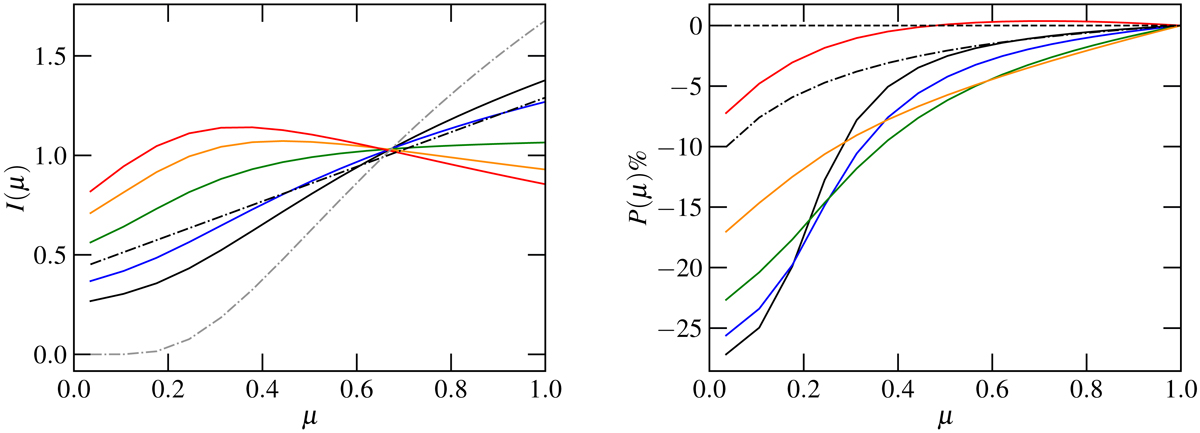
Angular dependence of emitted intensity (left panel) and PD (right panel). The angular dependence was normalized so that ![]() . Black, blue, green, orange, and red solid lines show the model for photon energies of 2, 5, 8, 12, and 18 keV, respectively. The black dot-dashed curves show the intensity and polarization corresponding to the classical results of Chandrasekhar–Sobolev (see Eq. (4)), corresponding to the optically thick electron-scattering dominated atmosphere. The grey dot-dashed curve in the left panel shows the angular dependence of intensity for unscattered photons. The model was calculated with the parameters shown in Table 1 (e.g. pmax = 0).
. Black, blue, green, orange, and red solid lines show the model for photon energies of 2, 5, 8, 12, and 18 keV, respectively. The black dot-dashed curves show the intensity and polarization corresponding to the classical results of Chandrasekhar–Sobolev (see Eq. (4)), corresponding to the optically thick electron-scattering dominated atmosphere. The grey dot-dashed curve in the left panel shows the angular dependence of intensity for unscattered photons. The model was calculated with the parameters shown in Table 1 (e.g. pmax = 0).
Current usage metrics show cumulative count of Article Views (full-text article views including HTML views, PDF and ePub downloads, according to the available data) and Abstracts Views on Vision4Press platform.
Data correspond to usage on the plateform after 2015. The current usage metrics is available 48-96 hours after online publication and is updated daily on week days.
Initial download of the metrics may take a while.