Fig. 5.
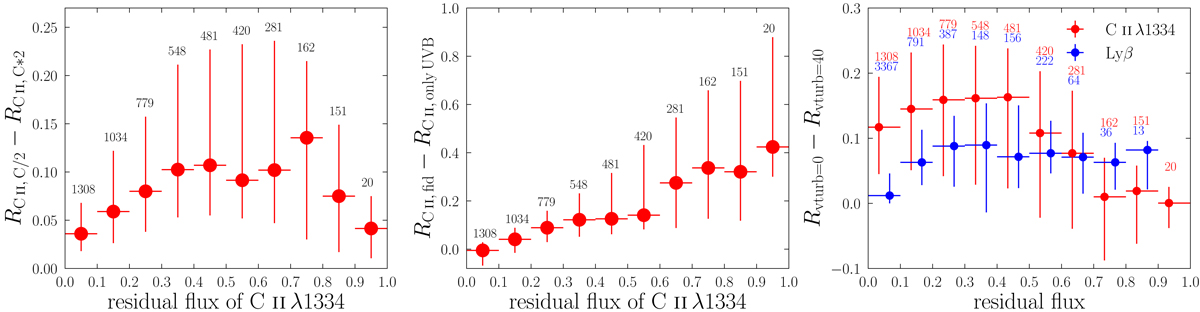
Effect of different parameters of the modeling on the residual fluxes. The y-axes display differences of residual fluxes between two setups. The dots are the median of the differences in a given bin of residual flux, and the bars show the 10th and 90th percentiles. The numbers indicate how many spectra are in the corresponding bin of residual flux. Left panel: effects of carbon density, which is divided or multiplied by two. Middle panel: effect of UVB radiation for ionizing photons instead of the radiation field from the simulation. Right panel: effects of turbulent velocity. Turbulent velocities are varied between 0 and 40 km s−1.
Current usage metrics show cumulative count of Article Views (full-text article views including HTML views, PDF and ePub downloads, according to the available data) and Abstracts Views on Vision4Press platform.
Data correspond to usage on the plateform after 2015. The current usage metrics is available 48-96 hours after online publication and is updated daily on week days.
Initial download of the metrics may take a while.