Fig. 13.
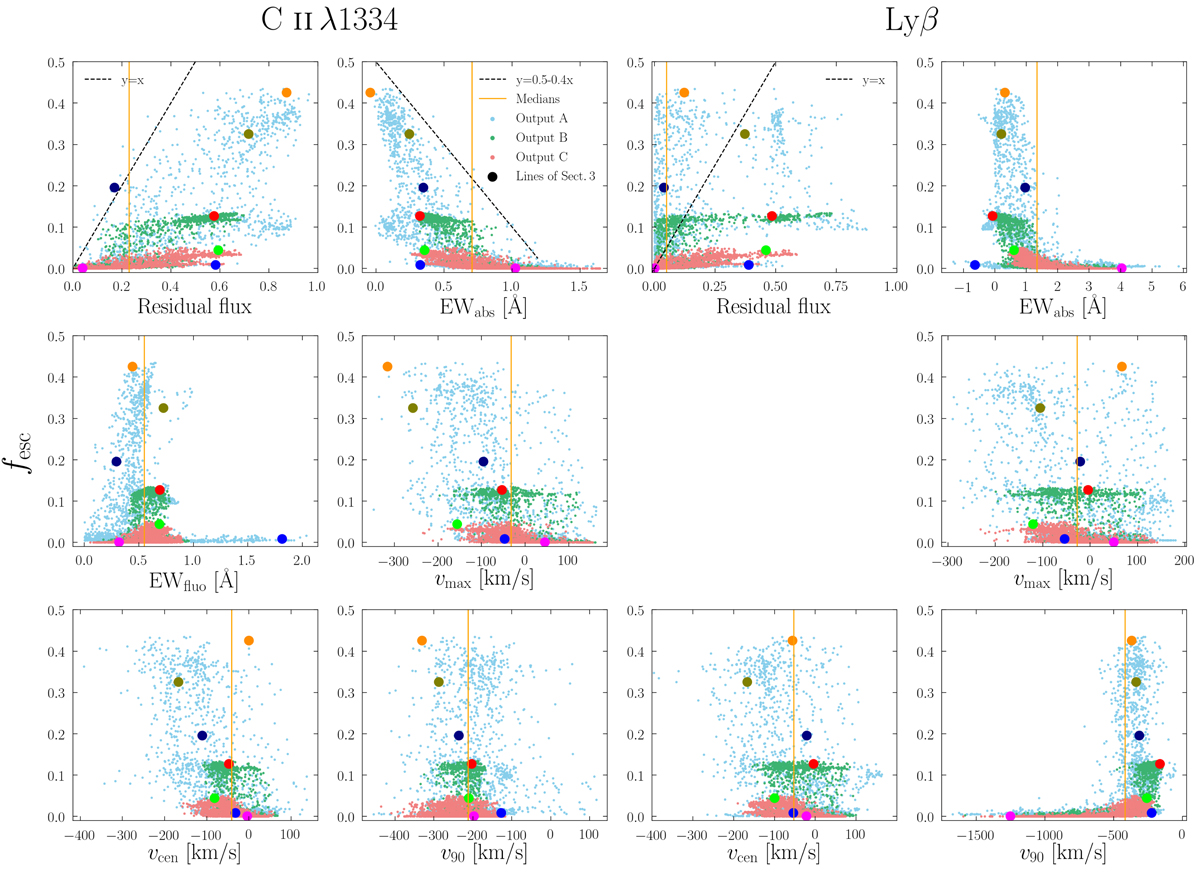
Scatter plots comparing the escape fractions for the three outputs in the 1728 directions of observation to the properties of the C II absorption line on the left and the Lyβ line on the right. The seven colored dots show the position of the spectra displayed in Sect. 3. EW_abs is the EW of the absorption line (negative EW_abs means more emission than absorption), EW_fluo is the EW of the fluorescent emission, vmax is the velocity of the deepest point in the spectrum, vcen is the velocity at which the absorption line has half its EW, and v90 is the velocity where the blue side of the absorption line reaches 90% of the continuum value. The orange vertical lines show the median value of the x-axis variable over the 5184 directions. There is no fluorescent channel for Lyβ, and so one panel is missing.
Current usage metrics show cumulative count of Article Views (full-text article views including HTML views, PDF and ePub downloads, according to the available data) and Abstracts Views on Vision4Press platform.
Data correspond to usage on the plateform after 2015. The current usage metrics is available 48-96 hours after online publication and is updated daily on week days.
Initial download of the metrics may take a while.