Fig. 8.
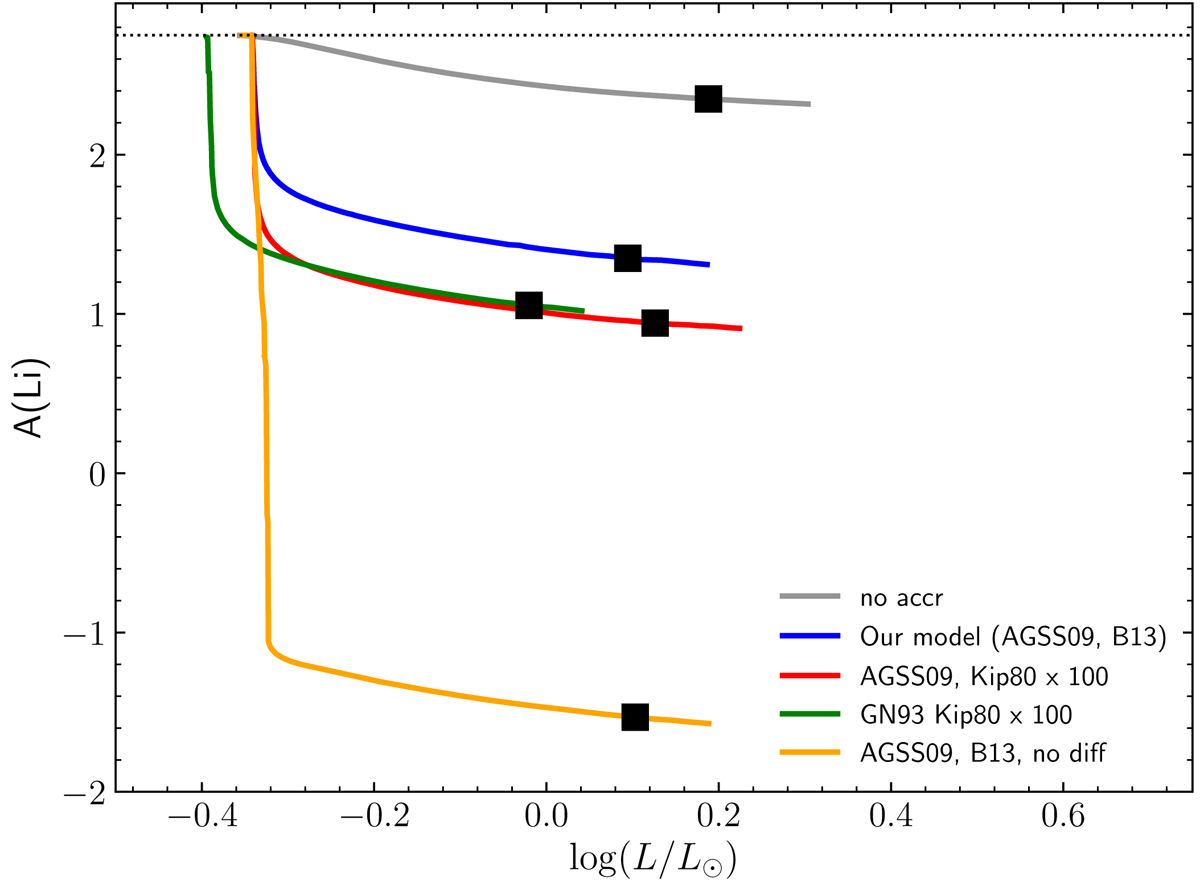
Evolution of lithium surface abundance in 0.75 M⊙ models with [Fe/H]ini = −2.31 for different input physics. The grey solid curve represents a model without accretion. All the other curves correspond to models of accreting stars with an accreted mass of 3 M♃. The blue curve represents a model including the physics used in this study namely AGSS09 for Asplund et al. (2009) initial metal mixture, B13 for Brown et al. (2013) thermohaline convection prescription, and atomic diffusion (see Sect. 3). The red curve represents a model taking into account the Kippenhahn et al. (1980) prescription for thermohaline convection multiplied by 100 (Kip80 × 100) and an AGSS09 initial mixture of metals. The green solid curve shows a model with the same prescription for thermohaline convection and an initial mixture of metals following Grevesse & Noels (1993; GN93). The orange curve represents a model with a similar physics than the blue model but without atomic diffusion (no diff). The black squares stand for the lithium surface abundance at 12.5 Gyr. The dotted horizontal line indicates the initial lithium abundance.
Current usage metrics show cumulative count of Article Views (full-text article views including HTML views, PDF and ePub downloads, according to the available data) and Abstracts Views on Vision4Press platform.
Data correspond to usage on the plateform after 2015. The current usage metrics is available 48-96 hours after online publication and is updated daily on week days.
Initial download of the metrics may take a while.