Fig. 3.
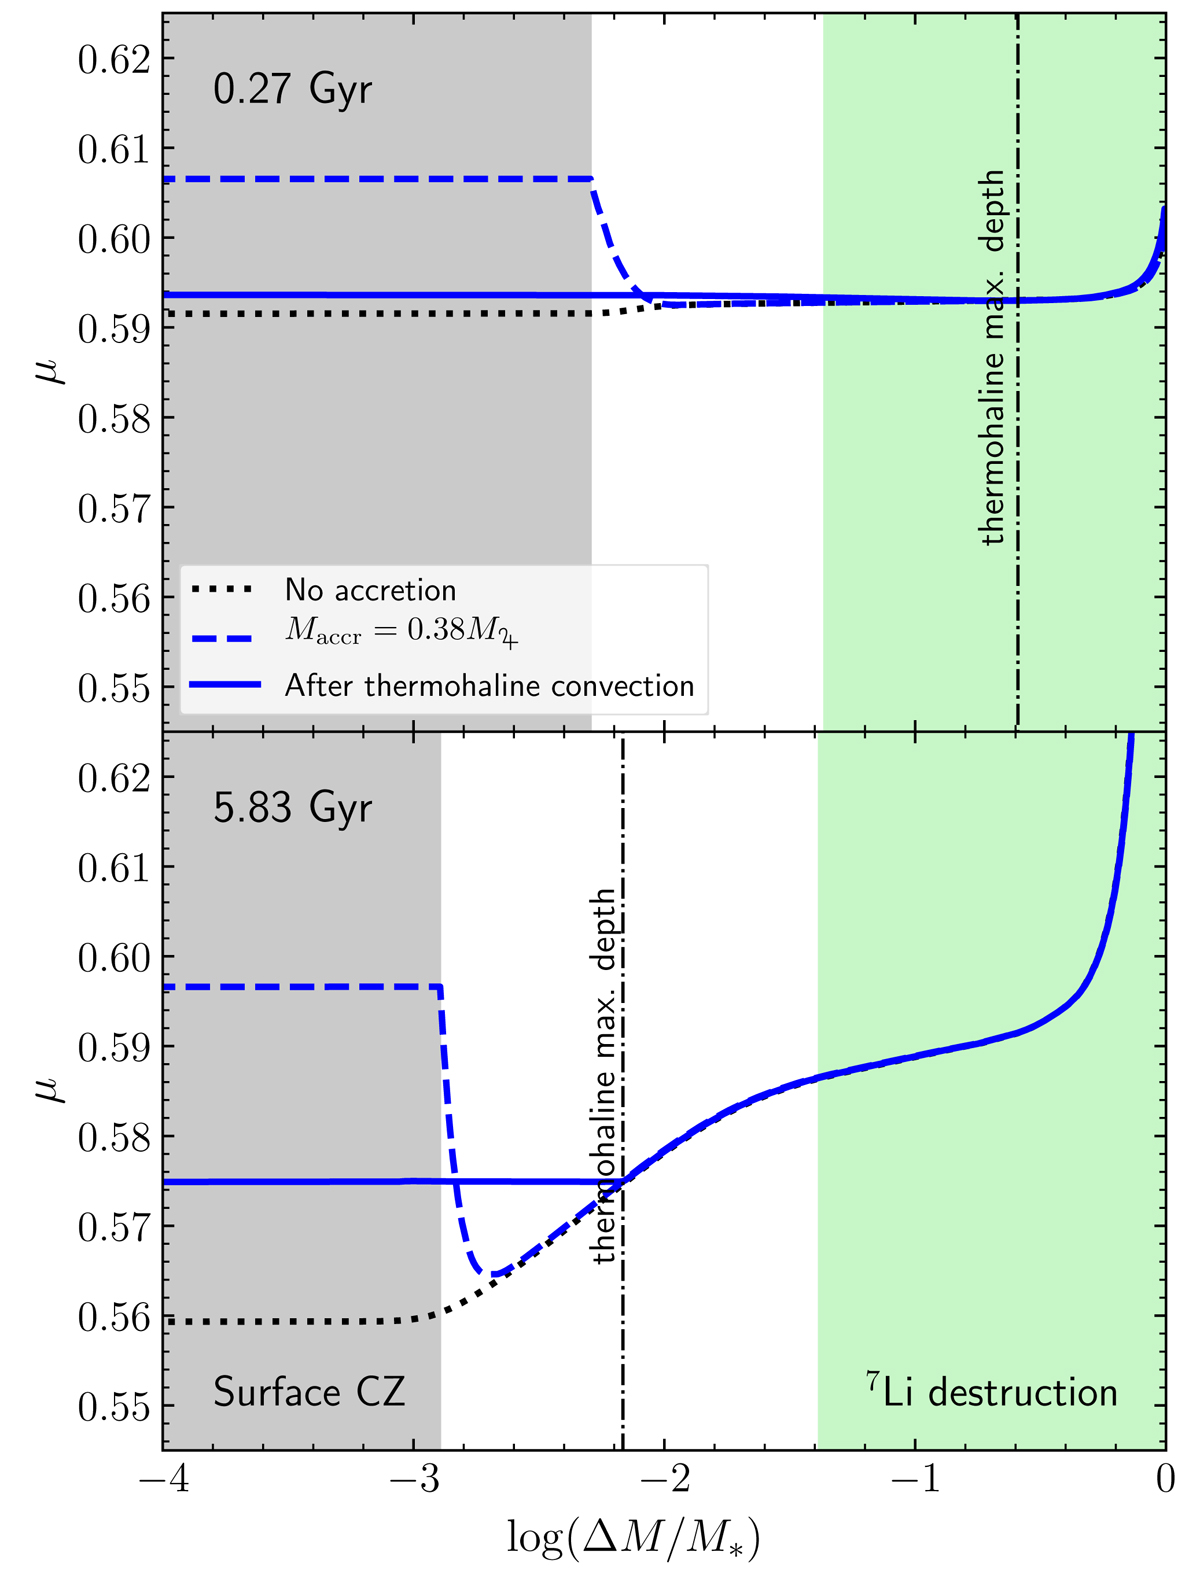
μ-profiles inside a 0.8 M⊙ model at two ages. The black dotted lines are the μ profiles without accretion, the blue dashed lines represent the situation just after the accretion phase, and the blue solid lines are after the thermohaline convection mixing. The grey area represents the surface convective zones and the green one the region of lithium nuclear destruction. The vertical dashed-dotted lines represent the maximum depth of the thermohaline mixing.
Current usage metrics show cumulative count of Article Views (full-text article views including HTML views, PDF and ePub downloads, according to the available data) and Abstracts Views on Vision4Press platform.
Data correspond to usage on the plateform after 2015. The current usage metrics is available 48-96 hours after online publication and is updated daily on week days.
Initial download of the metrics may take a while.