Open Access
Fig. 3.
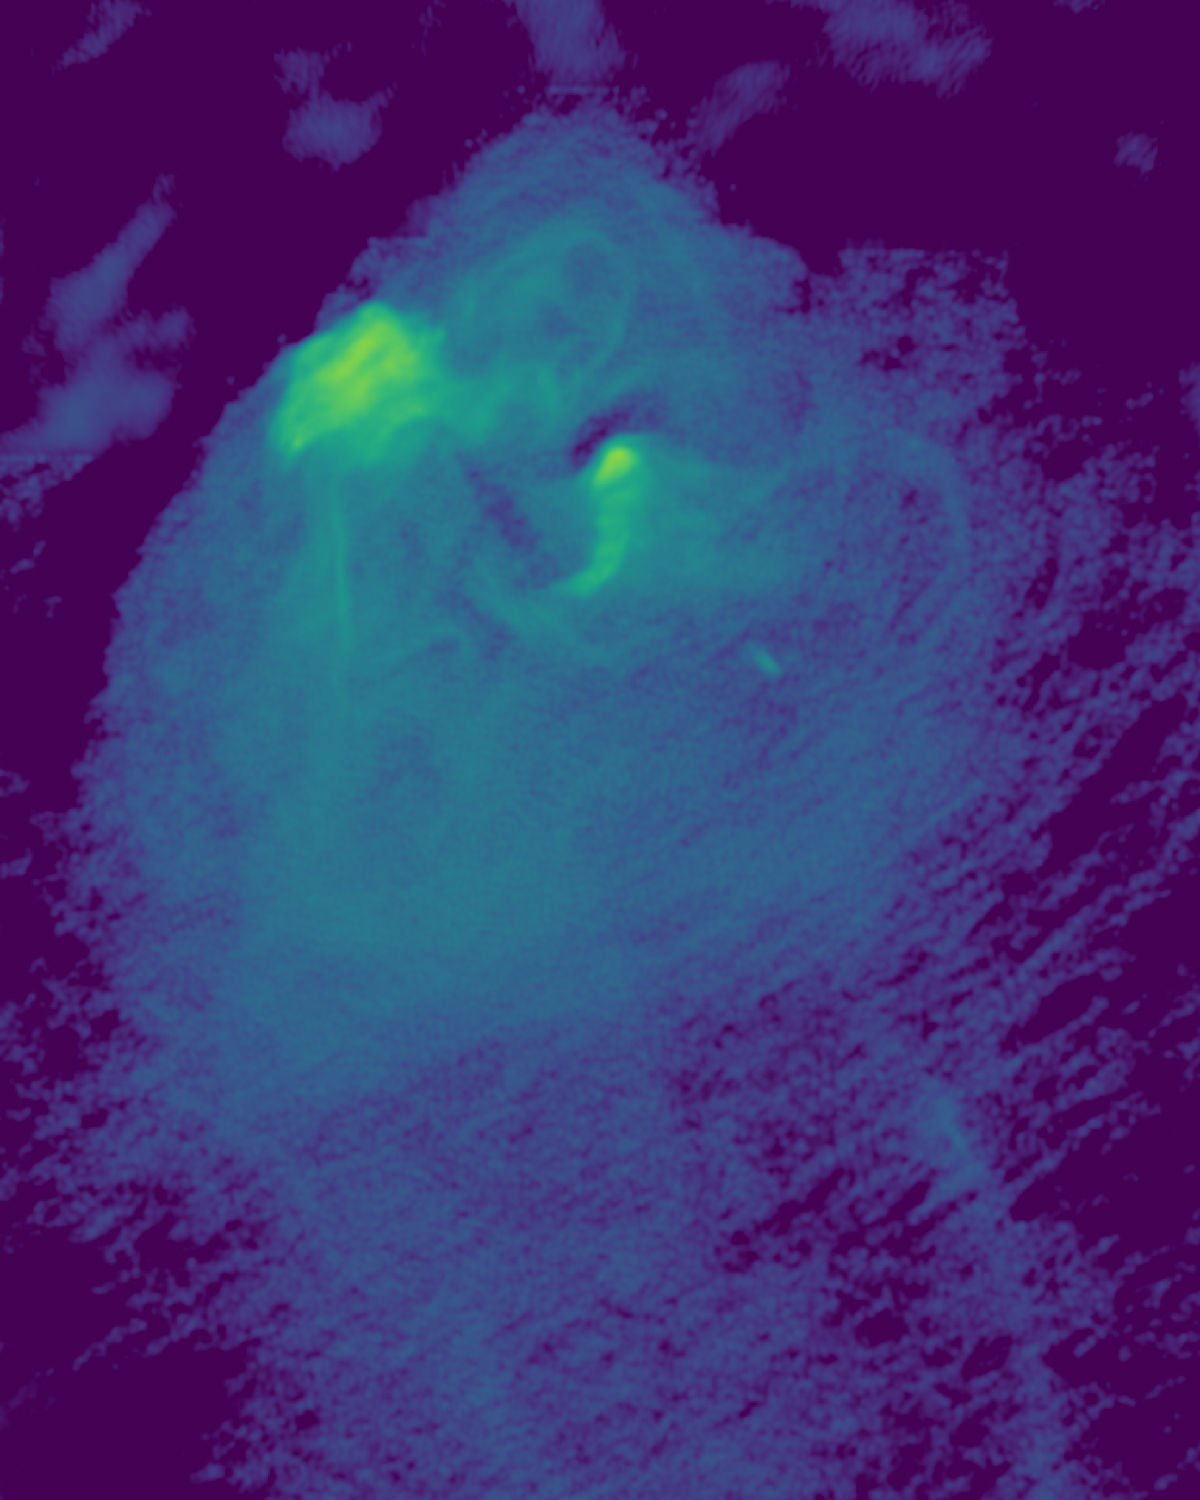
Zoomed-in version of the single-scale CLEAN reconstruction of the 13.36 GHz data set focusing on the western lobe and rotated anti-clockwise by 90 degrees. The colour bar is the same as in Fig. 1. Negative flux regions have been set to lower limit of the colour map.
Current usage metrics show cumulative count of Article Views (full-text article views including HTML views, PDF and ePub downloads, according to the available data) and Abstracts Views on Vision4Press platform.
Data correspond to usage on the plateform after 2015. The current usage metrics is available 48-96 hours after online publication and is updated daily on week days.
Initial download of the metrics may take a while.