Fig. A.4.
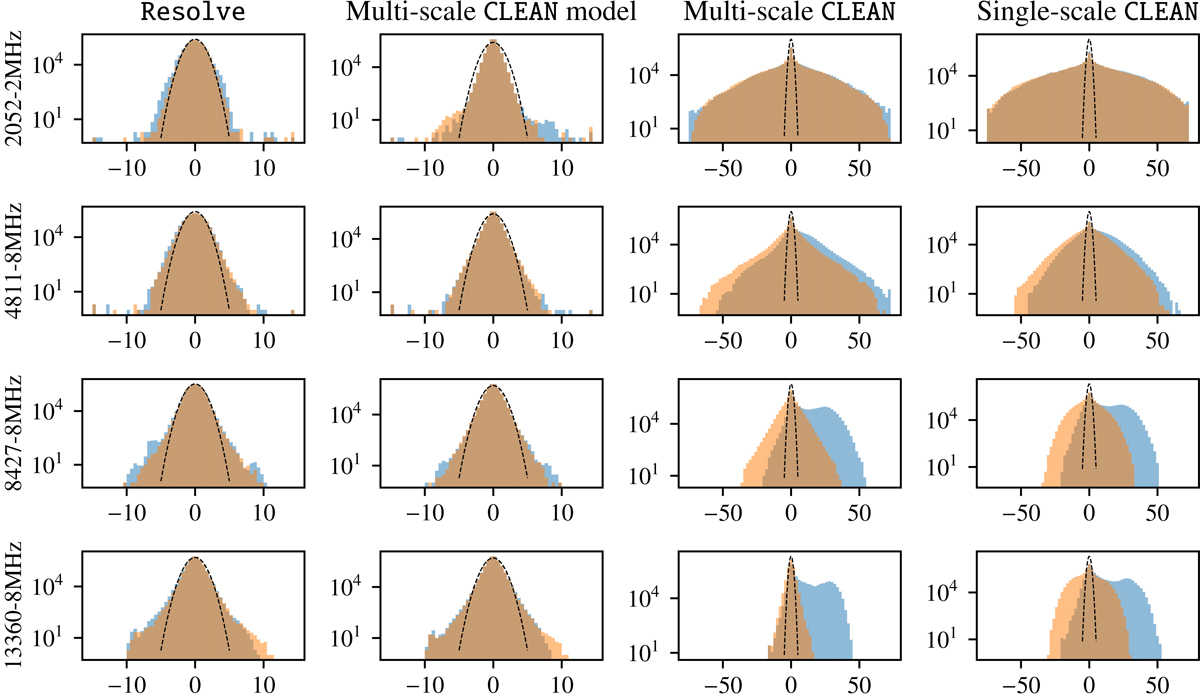
Histogram of (posterior) residuals weighted with σ(ξ(σ)), i.e. both the thermal noise and the Bayesian weighting scheme. Blue and orange bars denote real and imaginary parts, respectively. The black dotted line displays a standard normal Gaussian distribution scaled to the number of data points. For multi-scale CLEAN the residuals for both the model and restored image are shown. Histogram counts outside the displayed range are shown in the left- and rightmost bin.
Current usage metrics show cumulative count of Article Views (full-text article views including HTML views, PDF and ePub downloads, according to the available data) and Abstracts Views on Vision4Press platform.
Data correspond to usage on the plateform after 2015. The current usage metrics is available 48-96 hours after online publication and is updated daily on week days.
Initial download of the metrics may take a while.